What are the probabilities of double-digit gains in 2024?
What are the probabilities of double-digit gains in 2024?

There is a 74% probability the S&P 500 will achieve double-digit gains in 2024.
How did we get 74%? By following the data.
We looked at the annual returns of the S&P 500 starting from 1926, categorizing them into either secular bull or secular bear markets. 53 of those years fell into secular bulls.
This is what we found, based on that historical data for those 53 secular-bull years:
- None of the years showed a loss greater than 20%.
- The probability of a 10%–20% decline was 5.7%.
- 7.5% of the years had a loss of up to 10%.
- 13.2% of the years posted single-digit gains.
- 28.3% of the time, the market gained between 10%–20%. (The S&P 500 was in the 10%–20% range as of Dec. 5, 2023.)
- 45.3% of the time, the S&P 500 gains were over 20%.
Because I know the data, which is readily available, I am always amazed by the annual outlooks published by leading equity strategists. Most project single-digit gains each year. This is a safe bet, as the average S&P 500 return over both secular bulls and bears typically falls into the high single digits. But in secular bulls, single-digit gains occur only 13% of the time, which makes those predictions generally a poor call. A notable exception is Ed Yardeni, who often breaks from the herd to make more realistic forecasts.
At STIR, our analysis is quantitative and based on historical data. To determine our annual outlook—that there is a 74% probability of a double-digit gain next year—we delved deep to see what quantitative data exists to challenge or support that outlook. We also looked for data that might provide a clue about the scale of the advance.
Odds of an annual decline in a secular bull are slim—just 13.2%. There have been only seven negative years out of 53 cases, and each of those down years was preceded and followed by at least three consecutive years of gains.
The rate of inflation has been falling, indicating that the Federal Reserve’s battle plan is working. The consensus analysis, reinforced by comments coming from Fed speakers, is that the interest-rate hike that occurred on July 23 was the last of this recent series (or at least a pause for some time).
In seven previous cases during a rising-rate environment, the market has done well once the final rate hike was in place.
TABLE 1: S&P 500 AVERAGE CHANGE AFTER A FED PAUSE IN RATE HIKES

Sources: STIR Research, www.ndr.com
Breaking the seven cases between secular bulls and bears, the average gain we might expect is 25%. With the S&P 500 at 4,565 on July 26, 2023, that sets a goal of 5,700 by late July 2024.
The current bull market, which began on Oct. 12, 2022, recorded the weakest first-year gain compared to the previous seven bull markets. While the average first-year gain for these markets was an impressive 40.5%, the current bull market achieved a gain of “only” 21.6%. In the second year, all historical cases were positive, averaging a 12-month gain of 15.3%. Based on this rate of return, the S&P 500 would be trading above 5,000 by mid-October in 2024.
![]() Related Article: Expect rates to stay ‘higher for shorter’
Related Article: Expect rates to stay ‘higher for shorter’
It is rare for the S&P 500 to show losses over a rolling two-year period. This has only happened a few times since the secular bear market of the 1970s. However, merely being in negative territory is not a good buy signal. A more significant signal is an upward thrust of momentum or breadth, which indicates that a trend has reversed.
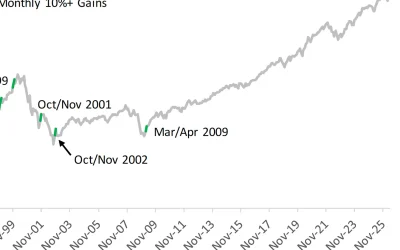
STIR employs an intermediate-term market signal known as the Market Environment Indicator (MEI), which measures the momentum and trend of over 100 subindustry groups that make up the broader S&P 500. Given its broad scope, weekly moves tend to be slight on a scale from 0 to 100. Therefore, a jump of more than 10 points in a single week is rare. Since 1987, there have been only six instances where a momentum thrust (a gain of more than 10 points) occurred while the MEI was in bearish territory. A seventh took place on Nov. 6, 2023.
FIGURE 1: RARE MOMENTUM THRUSTS IN MEI WHEN S&P 500 ROLLING TWO-YEAR RETURN IS NEGATIVE

Sources: STIR Research, FastTrack
Observations on this data:
- Six of the seven signals shown in Figure 1 came after the two-year rolling return started to rise, a valid reinforcement that the upward trend is real.
- The median 12-month gain following a jump of over 10 points when two-year rolling returns are bearish is 21.4%. This suggests that the S&P 500 should be trading above 5,300 by early November 2024.
- Once the bearish trend reversed, it was often followed by multiple years of significant returns.
Zweig Breadth Thrust Indicator generates a rare buy signal
Following the big market gains from Oct. 27 to Nov. 3, 2023, a CNBC Pro headline proclaimed, “The market just triggered a rare signal that has meant higher returns a year later 100% of the time.”
The Zweig Breadth Thrust Indicator flashed a buy signal for only the 18th time since 1945. In the preceding 17 instances, the S&P 500 recorded six- and 12-month gains that were three to four times higher than average. Half of these Zweig indicator signals came within days or weeks of major market turning points.
The infrequency and accuracy of this signal instill a lot of confidence. Eighty years of history show that when this signal is triggered, the average 12-month gain exceeds 23%. This sets an objective for the S&P 500 to reach 5,373 by early November 2024.
Other considerations
But what about a recession?
A recession has been in the forecast for much of 2023. Yet an economic downturn—formally defined as two consecutive quarters of declining GDP growth—has yet to happen.
And Q3 2023 GDP came in above 5%. Something no one was predicting. With employment strong, and the ratio of job openings to unemployment remaining high, the probabilities of a recession are overstated.
But recession fears could be a positive for the market. Fearful investors may initially remain on the sidelines, but as the market (and economy) rises, those cautious and defensive-prone investors should eventually turn into buyers.
Further, the earnings recession appears to be behind us. S&P 500 earnings are expected to rise by double-digits in 2024 and hit record highs.
Finally, the mega-cap stocks of the S&P 500 (known as the “Magnificant Seven” or “Elite Eight”) have been leading the market for what seems like forever. This has meant that the cap-weighted S&P 500 has been significantly outperforming the equal-weighted S&P 500, not to mention the Russell 2000. For example, as of Nov. 30, 2023, the equal-weighted S&P 500 is trailing the 12-month performance of the cap-weighted S&P 500 by a full 12 percentage points, 1.4% versus 13.7%. And the Russell 2000’s 12-month return has been running at the second-biggest negative comparison rate versus the S&P 500 since 2001.
Based on historical precedent, we should expect some reversion to the mean. A rally for the broader market beyond the larger-cap stocks could add further fuel for 2024 gains.
Our outlook
The data points to double-digit gains for the S&P 500 in 2024. STIR’s outlook is for the S&P 500 to finish between 5,300 and 5,500. However, we think there will be bigger gains for the Russell 2000 and the equal-weighted S&P 500, with returns over 20%.
The opinions expressed in this article are those of the author and the sources cited and do not necessarily represent the views of Proactive Advisor Magazine. This material is presented for educational purposes only.
 Marshall Schield is the chief strategist for STIR Research LLC, a publisher of active allocation indexes and asset class/sector research for financial advisors and institutional investors. Mr. Schield has been an active strategist for four decades and his accomplishments have achieved national recognition from a variety of sources, including Barron's and Lipper Analytical Services. stirresearch.com
RECENT POSTS

‘Optimized Outcomes’ explains core principles for creating and preserving wealth

Behavioral biases: Not just for investors

What does market history say about ‘Sell in May’?

Retiring boomers broke this important economic relationship