Market exuberance is in the eye of the beholder
Market exuberance is in the eye of the beholder

Extreme equity market valuations are relatively rare, but when they do occur, the hype, the risks, and associated client emotions can make them challenging for advisors.
New highs in equities are celebrated milestones—until they’re not. One catalyst that can turn investors from blind optimism to nervous contrarianism is extreme valuation.
A commonly held but naive view is that consistent new highs in the equity market tend to mask the market’s value relative to other benchmarks and lull investors into complacency. Then, when valuations reach extremes, alarm bells go off, investors cringe, and major corrections ensue.
However, in general, reality has not supported this view.
For one thing, no accepted valuation measure has provided a reliable “extreme” signal at the right points in history to support selling equities.
For another, media warnings tend to sensationalize a small number of notable instances when high valuations were followed by corrections. A broader view of history reveals many valuation extremes that were not followed immediately by corrections, as well as extremes that led to yet higher extremes.
As a result, investors who sold during periods of exceptionally high valuations, expecting to buy back when valuations swung to lows again, could have remained out of equities for years as valuations simply kept rising.
For better or worse, humans give more weight to recent or dramatic memories. Many investors still recall the real estate collapse of 2008 and the dot-com flameout of 2000. Consequently, high equity valuations can be especially unsettling when accompanied by a prominent investment theme with game-changing impact. Valuation extremes may therefore present more of a perceptual issue than a tactical one.
They can also push investors into an emotional quagmire. The disposition effect and loss aversion make people want to sell stocks to preserve gains. On the other hand, fear of missing out (FOMO) and a reluctance to realize taxable gains make them want to remain invested when equities are strong.
News of excessive valuations can then intensify loss aversion and tip investors toward selling, even though the market may still be far from a major top or facing only a brief, common correction within a longer-term uptrend. In short, high valuations can complicate an already emotionally sensitive time for many investors—and can place the challenge squarely in the laps of advisors.
Why relative valuations attract attention
The concept of relative value at the stock and sector levels has intuitive appeal, especially for institutions, which tend to place greater emphasis on rigorous portfolio diversification. At the market level, institutions may also compare U.S. equities to other markets or asset classes, again with an eye toward managing diversification.
Retail investors, however, tend to hold more concentrated portfolios and respond more emotionally to market developments. As a result, they pay more attention to equity valuations, particularly those that are benchmarked against earnings, GDP, and interest rates. For years, these comparisons may reveal little more than long-term valuation trends and the inevitable ebb and flow of capital in and out of various asset classes. But on a few rare occasions, optimism lifts these valuations to levels many consider unsustainable.
The significance of those periods is enhanced by their rarity and by the fact that some have preceded severe declines in equity prices. Because valuation measures are commonly incorporated into the big-picture economic views of financial firms, warnings about extremes frequently get pulled into headline news where they enter the consciousness of retail investors.
In mid-2026, equities have once again reached that point. Although 26 years have passed since the last major valuation-associated sell-off during the dot-com crisis, the memory still looms large for some investors, as does the 2008–2009 Great Recession.
Thanks to a strong economy; a uniquely business-friendly administration; and the unbridled optimism surrounding technologies such as AI, quantum computing, robotics, and space sciences, equities have reached relative valuation levels comparable to those seen before some of the most memorable sell-offs of the past quarter century.
Current valuations are elevated according to several measures
Evaluating whether equity valuations are excessive is complex, in part because no single measure has been consistent across previous market peaks. The data analysis firm Current Market Valuation provides a variety of current valuation measures with explanations and charts using data from the most recent quarter-end.
The site assesses different measures by the number of standard deviations between the most recent value and historical averages. It then classifies them using the following labels: Strongly Undervalued, Undervalued, Fairly Valued, Overvalued, or Strongly Overvalued.
Using June 2026 quarter-end numbers, their assessments were as follows:
- Buffett Indicator Model (total U.S. market value over GDP): Strongly Overvalued
- Price/Earnings (P/E) Model—CAPE (S&P 500 value over 10-year average earnings): Strongly Overvalued
- Price/Sales Model (S&P 500 value over one-year sales): Strongly Overvalued
- Interest Rate Model (S&P 500 value relative to interest rates): Overvalued
Adding to current concerns is the fact that the Buffett Indicator is at levels never seen before. Because Warren Buffett has been so widely followed and respected, his firm’s actions carry outsized weight among investors.
Berkshire Hathaway has been a net seller of equity positions for more than three years, according to The Motley Fool. It has accumulated $397 billion sitting in the safest assets around (cash and T-bills), which is “equal to more than a third of the entire company’s market value. By Berkshire’s own measure, cash has never stood so high as a share of the company.”
The article adds,
“This isn’t the first time Berkshire has let cash pile up. In the late 1990s, as technology stocks soared, Buffett sat out the mania and took plenty of criticism for it, until the dot-com bust vindicated the patience.
“Cash climbed again ahead of the 2008 financial crisis. And when prices finally cracked, Berkshire deployed aggressively. …”
 Related Article: Are investors motivated by more than two emotions?
The problems with extreme equity valuations
Because earnings are among the most commonly used benchmarks for determining equity valuations, we can use the market’s P/E history to illustrate some of the problems associated with extreme valuations.
Robert Shiller’s cyclically adjusted P/E ratio (CAPE) is a modification to the standard P/E valuation methodology. It uses a 10-year average earnings number to smooth the effects of the business cycle. The CAPE ratio shows a better relationship between valuations and expected returns over the next 10-15 years than the standard P/E.
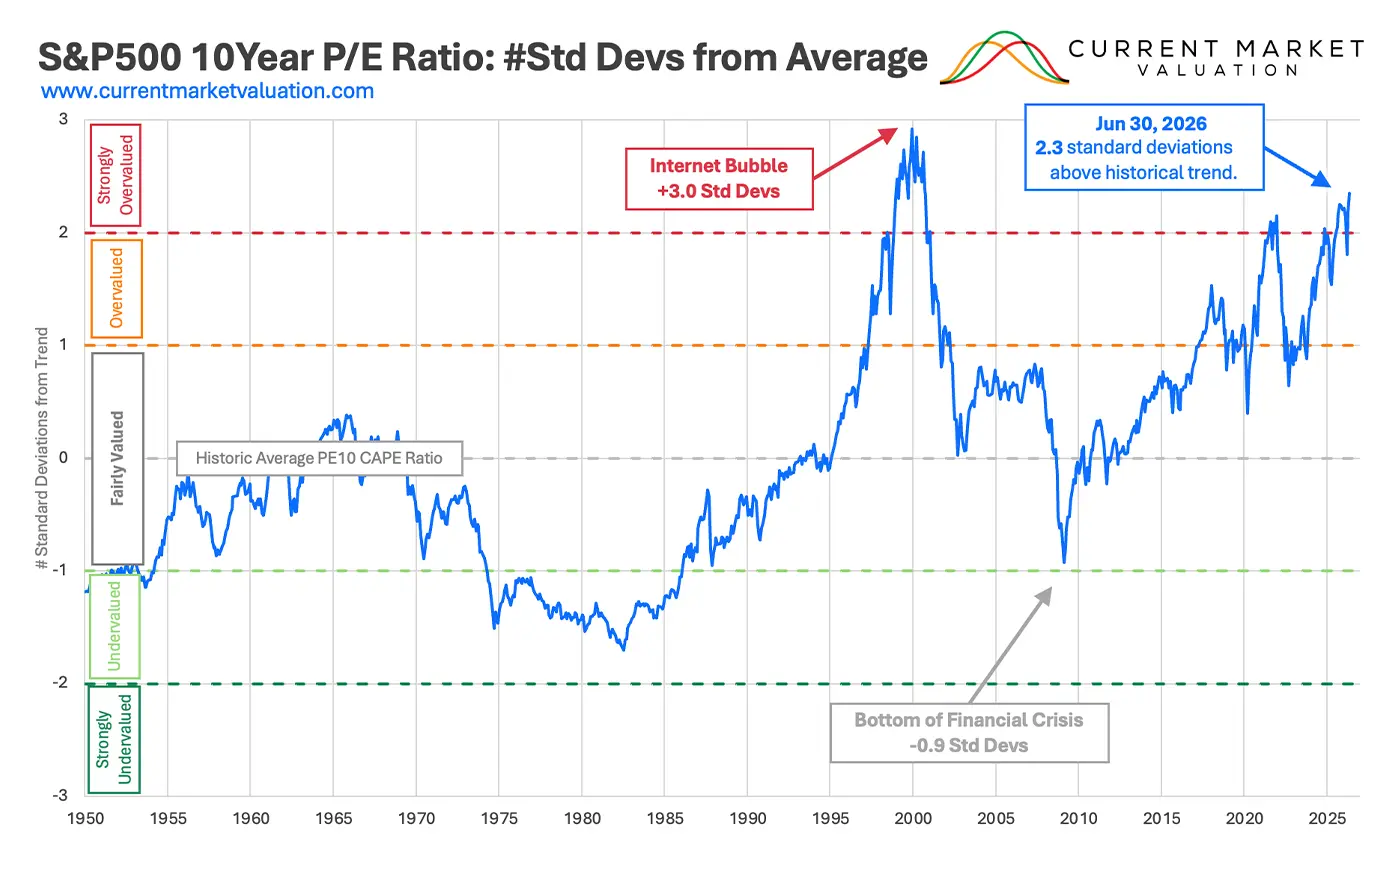
Figure 1 shows the S&P 500 10-year P/E ratio at 39.7 at the end of the second quarter of 2026. That was 92% above the modern-era market average of 20.7, putting the current 10-year P/E ratio 2.3 standard deviations above the modern-era average.
FIGURE 1: OVERVIEW OF THE S&P 500 10-YEAR P/E RATIO (CAPE)
Source: currentmarketvaluation.com. Data as of 6/30/2026.
Several observations can be drawn from the chart:
- No consistent level for prior extremes: The chart shows how variable P/E ratios have been over the years, how different today’s levels are from those of the 1900s, and how difficult it would be to peg a single number as representing a true extreme.
- Notable increase in P/E over time: P/E ratios have also noticeably increased over time. A regression line through all the data suggests that P/E ratios have pretty much doubled over the period.
Analysis by Current Market Valuation makes a convincing point: “Changing market structures (e.g., heavier weight on high-growth tech stocks) have reasonably driven increased average CAPE ratios over time, as could/may have a multitude of other exogenous factors (e.g., recent Fed interest rate policies promoting low rates and high growth). As long as the economy/industry doesn’t revert back to that of the 1960’s, why should we expect market P/E ratios to?”
- P/E is sensitive to earnings as well: P/E ratios vary with earnings as much as with price, making the ratio change over time for completely different reasons. During the COVID crisis, for example, earnings temporarily tumbled, causing the S&P’s P/E ratio to skyrocket. Investors who liquidated positions solely because of high P/E ratios could therefore have sold after some recessions or slowdowns rather than before.
- Equity valuations can persist for years without leading to a major correction: Former Federal Reserve Chair Alan Greenspan made his well-known “irrational exuberance” speech in 1996 as the market’s P/E ratio was over 20. It took almost five years—and the P/E ratio roughly doubling—before the market finally rolled over into a bear market.
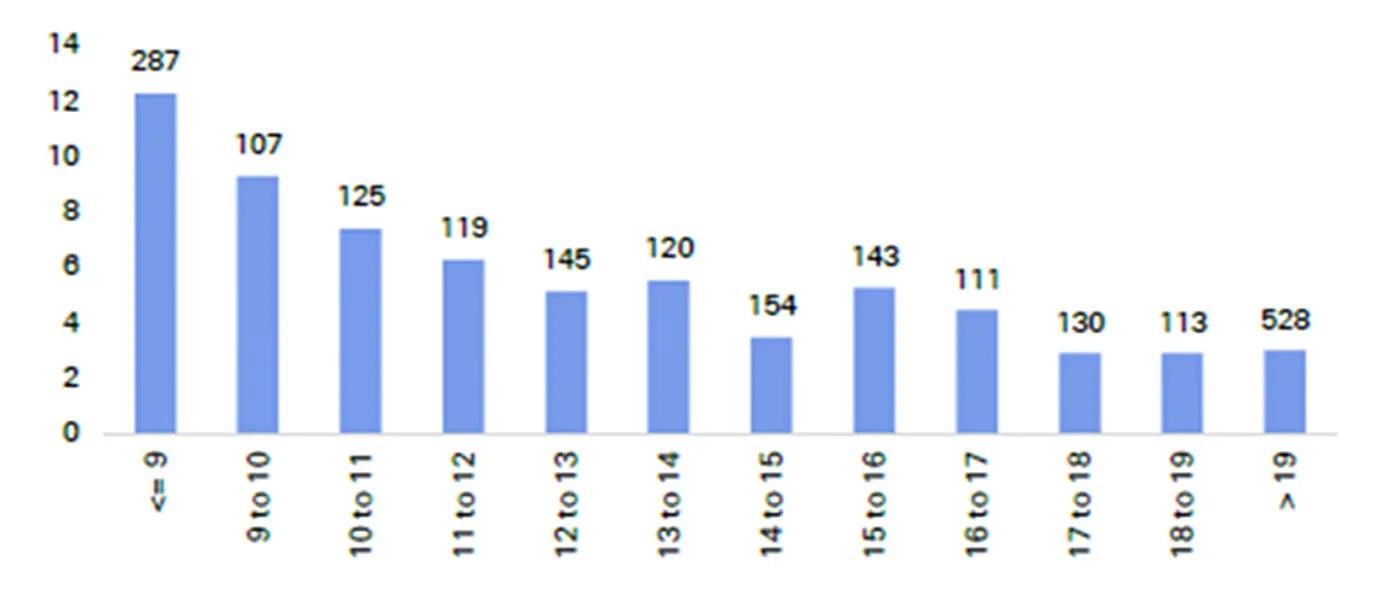
An alternate approach to valuations is to compare starting P/E valuations with subsequent five-year equity returns. A February 2026 analysis by Justin Larson, CFA at Innovative Planning Group, showed the following relationship between the S&P 500’s P/E ratio and the subsequent five-year return.
FIGURE 2: MEDIAN 5-YR REAL STOCK RETURN BY BUCKETS OF STARTING P/E RATIO
Note: Vertical axis represents total return; date labels above each column are the number of observations within each interval.
Sources: Finaeon, Bloomberg Finance LP, Haver Analytics, Deutsche Bank
The chart’s overall shape suggests that lower P/E ratios (those below roughly 12) tend to be followed by more attractive five-year returns. Above 12, however, there appears to be little evidence that forward returns continue to fall by much as P/E ratios rise. Given that P/E ratios above 20 have been the norm for the past decade, it is hard to see how investors would gain an edge by being in the market only during periods of very low P/E ratios.
Furthermore, the inverse relationship between high valuations and generally lower future returns tends to emerge only over time horizons of at least five to 10 years. This analysis does not demonstrate that valuation extremes necessarily lead to immediate declines.
That offers little consolation to investors concerned that extreme valuations could be followed by sell-offs in the subsequent weeks or months. The realities of extremes thus demonstrate that finding a practical approach for dealing with them is highly challenging, as is finding a single approach that will suit all clients.
More client-relevant than market-relevant
As valuations reach extremes, investors often ask whether they are justified. But judging price multiples can be as subjective as judging the fears they provoke, especially considering the variability and uncertainty involved.
A more practical question for clients and advisors is, “Do current valuations justify any action?” Framing the issue this way allows potential responses to be tailored to each client’s circumstances.
Behavioral research helps explain why extreme valuations can make investors anxious. Market uncertainty, coupled with loss aversion, can produce the disposition effect—the tendency to sell investments to lock in gains. As gains build, that impulse may strengthen, particularly with regard to nontaxable accounts. After a long market advance, investors may also become increasingly nervous about a pullback and more sensitive to signs that one could be approaching.
News that equities have reached levels associated with past major declines can then ignite the disposition effect. Yet valuation extremes may persist or rise further for months or even years. The challenge for advisors, therefore, is not to predict exactly when or how a correction might take hold, but to help clients address the anxiety those valuations create.
That anxiety is real to clients and will vary with each client’s age, experience, risk profile, and other circumstances. In that sense, the issue is more client-relevant than market-relevant. Therein lies the challenge for advisors, who must respond as they do to many other client perceptions and behaviors: by addressing the clients’ concerns and suggesting actions suited to their individual situations.
For most clients, the issue is nuanced. How old are they? How risk averse? Are their accounts taxable? How concentrated are they in stocks with sky-high valuations? Are they candidates for option-hedging strategies rather than outright sales? Are they driven more by FOMO or by loss aversion? Does their portfolio construction include some level of risk-managed strategies, which should inherently help mitigate drawdowns?
In general, high valuations are good news for equity holders. The challenge is often more manageable than the opposite problem: falling prices and declining account values. A deeper understanding of both relative valuations and investor perceptions may help advisors manage their way through the issue.
The opinions expressed in this article are those of the author and the sources cited and do not necessarily represent the views of Proactive Advisor Magazine. This material is presented for educational purposes only.
 Richard Lehman is an adjunct finance professor at Cal Poly. He specializes in behavioral finance and financial derivatives, and has authored three books. He has more than 40 years of experience in financial services, working for major Wall Street firms, banks, and financial-data companies.
RECENT POSTS

Passing the baton to the next generation of financial advisors

The age of immediacy—and why investing still requires patience

Committed to clients’ financial clarity and confidence

Existing home sales slide in August, but affordability may improve