Fosback’s Absolute Breadth Ratio shows a quiet market
Fosback’s Absolute Breadth Ratio shows a quiet market

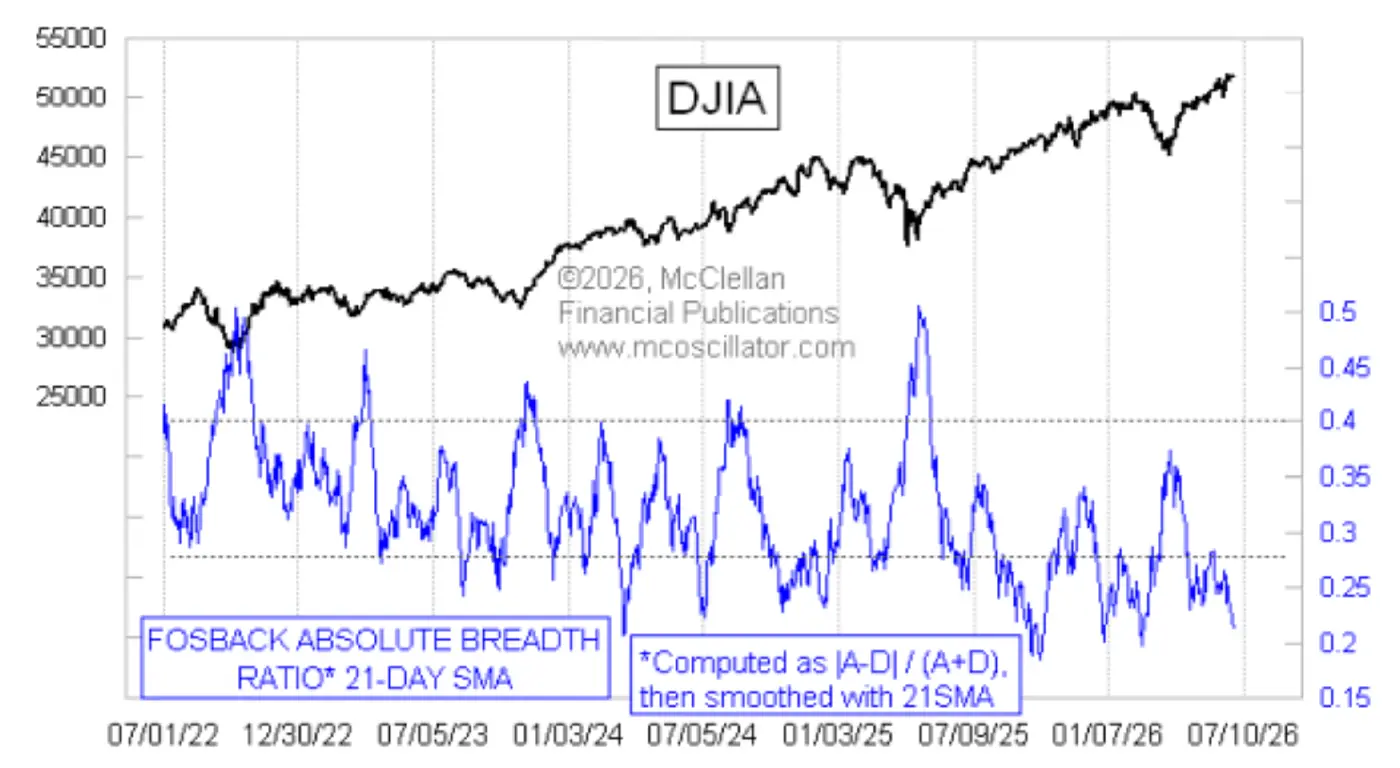
Years ago, analyst Norman Fosback hatched the idea of looking at the absolute value of the daily breadth, or advance-decline, numbers. He discarded the direction—that is, whether it was positive or negative—and focused only on how big the numbers were in recent days. That is what the following chart shows, using a 21-day simple moving average to smooth the data.
Source: McClellan Financial Publications
The principle behind this is that at market bottoms, things get loud and hectic, both upward and downward. So high readings for absolute breadth numbers show a bottoming condition for prices. Tops are the opposite, with things getting quiet. So a low reading shows a topping condition.
This is the point in the discussion where I insert one of my most essential points: A “condition” is not a “signal.” The market can remain overbought, or overly optimistic, for a while before that condition decides to matter. So this is another in a long series of indicators that will not tell you exactly when prices will turn. It only tells us that a top is due.
It is worth noting that there was a big low reading for this indicator in September to October 2025, and the market kept trending higher anyway. That is an important lesson about indicators generally. A strong trend, either up or down, can ignore topping and bottoming conditions. So if you see such a condition and it does not matter, that is a good way to know you are in a strong trend.
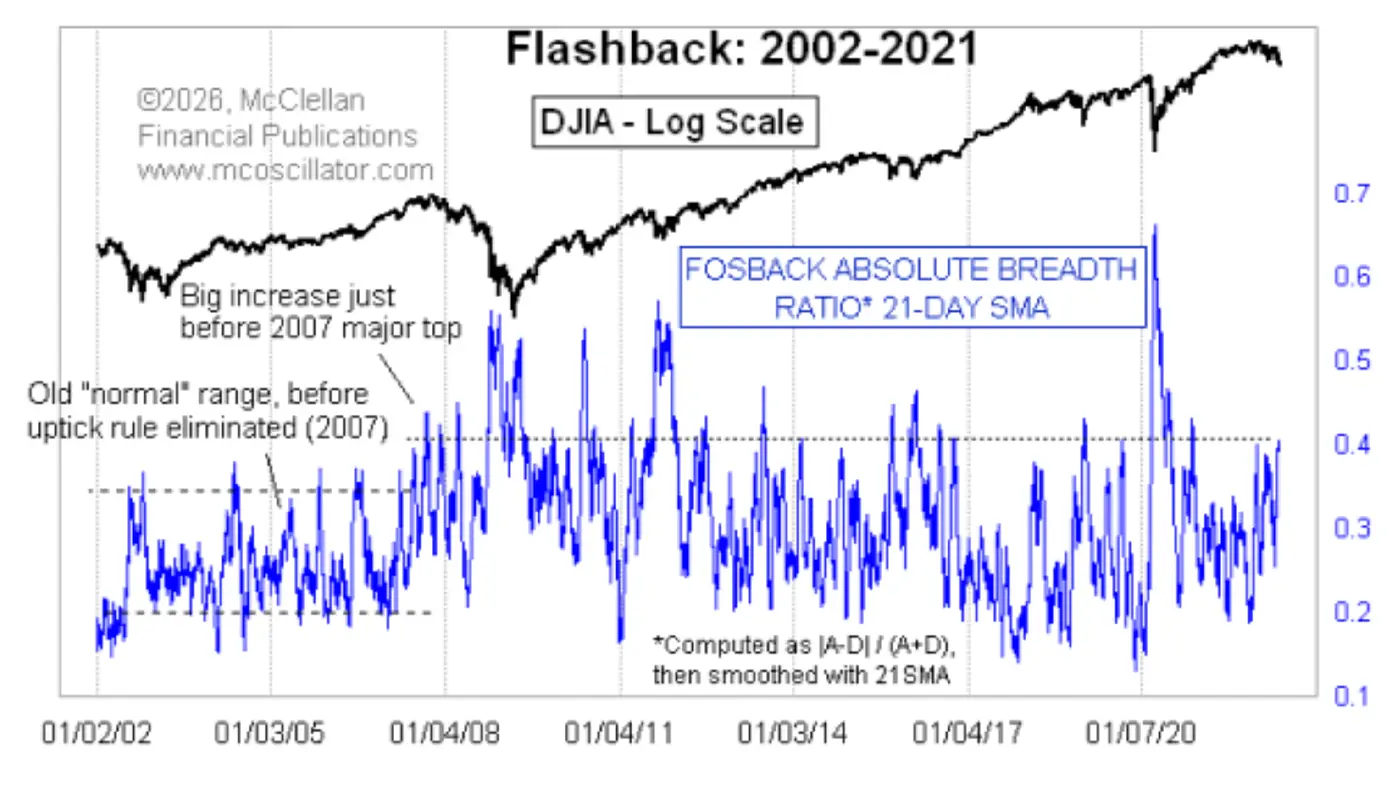
One other point worth noting is that one must be careful when deciding what counts as a “high” or “low” reading. Those levels can change over time. Here is a longer-term chart from a few years ago to help make this point.
 Related Article: Investing with the trend: Lessons learned from 50 years in the markets
Source: McClellan Financial Publications
Notice that during the early 2000s, the values had a much lower range than they did later. It may be a coincidence that the “uptick rule” for shorting stocks was eliminated in 2007, right when this indicator experienced a big range expansion. And 2007 was also interesting because we did not see a low reading to mark that year’s major price top.
We are seeing a low reading now in June 2026, as shown in the first chart above. And the range of values has been drifting a bit lower since the April 2025 tariff tantrum. That could reflect a new regime of values for this indicator, or it could just be normal variation. The point is that one cannot reliably pick a threshold for this indicator to hit and then trade off it. This is not a trading signal type of indicator.
But it is still a useful piece of information. It helps us to see that the breadth data are acting abnormally quiet, which is a sign that things are about to get spicy again.
This is an edited version of an article that first appeared at McClellan Financial Publications on June 26, 2026.
The opinions expressed in this article are those of the author and the sources cited and do not necessarily represent the views of Proactive Advisor Magazine. This material is presented for educational purposes only.
 Tom McClellan is the editor of The McClellan Market Report newsletter and its companion, Daily Edition. He started that publication in 1995 with his father Sherman McClellan, the co-creator of the McClellan Oscillator, and Tom still has the privilege of working with his father. Tom is a 1982 graduate of West Point, and served 11 years as an Army helicopter pilot before moving to his current career. Tom was named by Timer Digest as the #1 Long-Term Stock Market Timer for both 2011 and 2012. mcoscillator.com
RECENT POSTS