Unraveling the 2025 market collapse: The hidden dynamics of market participants
Unraveling the 2025 market collapse: The hidden dynamics of market participants

In the evolving landscape of global finance, the U.S. stock market has long been regarded as a bellwether for economic health and investor sentiment. Yet in the spring of 2025, the market was rocked by a collapse of such speed and magnitude that even seasoned analysts found themselves questioning the established narratives. Behind the tariff headlines and the charts, a complex web of market participants—each wielding distinct strategies and motives—quietly orchestrated the dramatic moves that rippled through portfolios and the economy.
This article presents a technical analysis of the U.S. stock market’s unprecedented decline from late March to early April 2025, as well as current market activity. The S&P 500 is used for this analysis as it is the benchmark index for the largest public corporations in the U.S. (Note: Technical analysis does not predict outcomes; it is similar to weather forecasting, using cycle analysis and long-term observation.)
The market participants that controlled the value of the S&P 500 during that sudden and extreme volatility included the following:
- Sell-side institutions, primarily money center banks, investment banks, and brokerages.
- Buy-side institutions, the fiduciary entities for the vast wealth of America’s upper and middle classes. These include pension and retirement fund managers, insurance companies, ETF developers, and mutual fund companies. Often referred to as “the dark pools” of liquidity, buy-side firms collectively hold trillions of dollars in assets under management. In contrast, the sell side holds far less in assets, primarily for short-term trading rather than long-term investment.
- High-frequency trading firms (HFTs), which run fully automated systems programmed to respond to a lack of buyers or sellers. HFTs queue orders seconds before the market opens, creating opening gaps that can either fill or continue price action in the same or opposite direction. HFTs are liquidity makers and “takers” for the public stock exchanges.
Smaller fund managers, those with less than $5 billion in assets under management, also contributed to the huge selling action at that time.
Retail investors and 401(k) retirement fund owners did not materially affect the volatility and are not part of this analysis.
In total, our analytical framework identifies 12 different market participant groups—far more than the oversimplified “Wall Street vs. Main Street” dichotomy. That outdated distinction does not really exist in today’s algorithm- and AI-driven stock market.
The technical signs behind the spring 2025 fall and rebound
The extreme volatility was dominated by the three groups identified in the previous section.
Extremely volatile markets start with selling pressure from the buy-side dark pools. In November 2024, these institutions started a quiet rotation out of equities they viewed as vulnerable to the political changes following the national election.
This shift—reducing exposure to perceived high-risk stocks to invest in a smaller group with higher growth potential—is seen in the following S&P 500 chart as a rounding formation in the candlesticks and a flattening of the trend. Volume also dropped to average or slightly below-average levels. This pattern signaled mounting stress in the market four to five months before the S&P 500 collapsed and rebounded.
On a logarithmic daily chart of the S&P 500, the rounding trend-line pattern and the flattening of the trend appear between August and December 2024. By that time, the market was already in a technically stressed condition, with retail groups and smaller fund managers buying less as capital reserves depleted.
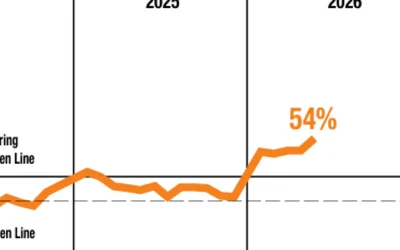
A TECHNICAL TIMELINE OF THE 2025 MARKET COLLAPSE AND REBOUND

Note: TWAP refers to time-weighted average price, a trading strategy for placing orders.
Source: TechniTrader
Once the market moved from a rounding top to a flat top, the buy side paused rotation but did not resume accumulation. As a result, the most important market participant group was sidelined—either preparing for a potential event or anticipating panic selling from the retail group due to fear of a volatility event. The buy side had ample cash reserves to “support the market” if necessary.
It is my belief that “support of the market” is an informal, loosely agreed-upon strategy among major institutions. It was first attempted in 2019, established in 2020, and used again in 2022 to maintain the value of the three major stock market indexes above the 20% decline threshold that defines a bear market. Indexes might drop slightly below that mark, but within days or weeks, the buy side would step in to maintain the 20% low, thereby encouraging pension fund owners to hold long term. This approach, I believe, was agreed upon after the banking debacle of 2008, which caused a severe market collapse and erased trillions of dollars from middle-class America’s pension fund accounts.
The stock market started a slow, controlled correction in late February and into March. Sell-side institutions were the market makers, as they typically are when stressed markets are at risk of entering bear territory. These institutions used credits from the Federal Reserve, which had stepped in quickly to buy bonds from the banks in exchange for digital credits, which trade like currency in the markets. The sell side did not drive stock prices down. They never do. Instead, acting as market makers, they moved their buy-to-cover orders well below the current price. When the retail groups and smaller funds panic, the first consequence is a lack of buyers. This triggers programmed trading to gap or run down the prices of individual stocks to the level where there are buyers or buy-to-cover orders.
After the extreme price swings in April, the S&P 500 resumed its uptrend, supported by the strength of most U.S. corporations. Many of these corporations now operate globally, so the current tariff proposals should not impact their profitability as much as many fear. The Technology sector, driven by AI initiatives, is particularly strong in the U.S.
![]() Related Article: How long can the AI-driven bull market last?
Related Article: How long can the AI-driven bull market last?
Lessons from the 2025 market collapse
The 2025 U.S. stock market collapse revealed the intricate interplay among various market participants and the unseen forces that shape volatility. While retail investors remained largely passive, it was the coordinated, though subtle, maneuvers of the buy-side institutions—particularly the so-called dark pools—along with sell-side banks, HFTs, and select smaller funds that dictated the market’s fate.
The stealthy rotation of assets ahead of the political transition in January 2025 signaled stress well before the dramatic sell-off, reminding us that the true narrative of market crises is often written in hidden patterns and silent shifts beneath the surface. Understanding these dynamics is essential for investors and observers alike as they navigate an increasingly complex, digital, and AI-driven financial landscape.
The opinions expressed in this article are those of the author and the sources cited and do not necessarily represent the views of Proactive Advisor Magazine. This material is presented for educational purposes only.
 Martha Stokes, CMT, is the co-founder and CEO of TechniTrader and a former buy-side technical analyst. Since 1998, she has developed over 40 TechniTrader stock and option courses. She specializes in relational analysis for stocks and options, as well as market condition analysis. An industry speaker and writer, Ms. Stokes is a member of the CMT Association and earned the Chartered Market Technician designation with her thesis, "Cycle Evolution Theory." www.technitrader.com
RECENT POSTS