


While it is often recited in technical analysis circles that market breadth should ideally lead price in healthy uptrends, it is rarely observed.
Before 2019, there had been only nine observations of this condition since 1940, when, after a drawdown of 10% or more, the NYSE Advance-Decline Line made a new multi-year or all-time high while the major price indexes were comparatively lower.
These “positive divergences” between the major price indexes and the NYSE Advance-Decline Line occurred in November 1942, October 1949, June 1978, May 2003, December 2009, August 2010, January 2012, April 2016, April 2018, and February 2019. Of the prior nine positive divergences, eight of them (89%) ushered in a new bull market or all-time price highs (the exception being in 1978).
Thus, we can conclude that this rare condition carries a significant probability of identifying the early stages of an important, long-term advance to new market highs.
Using this historical evidence to examine the market advance from the December 2018 low to the new all-time high in the NYSE Advance-Decline Line on Feb. 15, 2019, suggested that fresh bull market highs would follow in the months ahead.
Fulfilling this pattern, the S&P 500 Index and the NASDAQ Composite both reached new all-time highs on April 23—their first since Sept. 20, 2018, and Aug. 29, 2018, respectively. In terms of the NYSE Advance-Decline Line, the February high was its first since Aug. 29, 2018.
As such, the Feb. 15, 2019, NYSE Advance-Decline Line high was the most recent example of breadth leading price from a significant market low, with new market highs achieved 68 days later. Importantly, the NYSE Advance-Decline Line has continued to march to more highs as recently as May 3.
This continuation of breadth leading price suggests that the market has likely not yet reached a major top. Rather, Lowry’s historical research shows that breadth indicators such as the NYSE Advance-Decline Line are most frequently already in long-standing downtrends at final bull market price highs (i.e., display negative divergences).
In the following table, we have divided the aforementioned positive divergences into two groups—one for post-correction and the other for post-bear market.
TABLE 1: POSITIVE ADVANCE-DECLINE LINE DIVERGENCES
POST-CORRECTION AND POST-BEAR MARKET
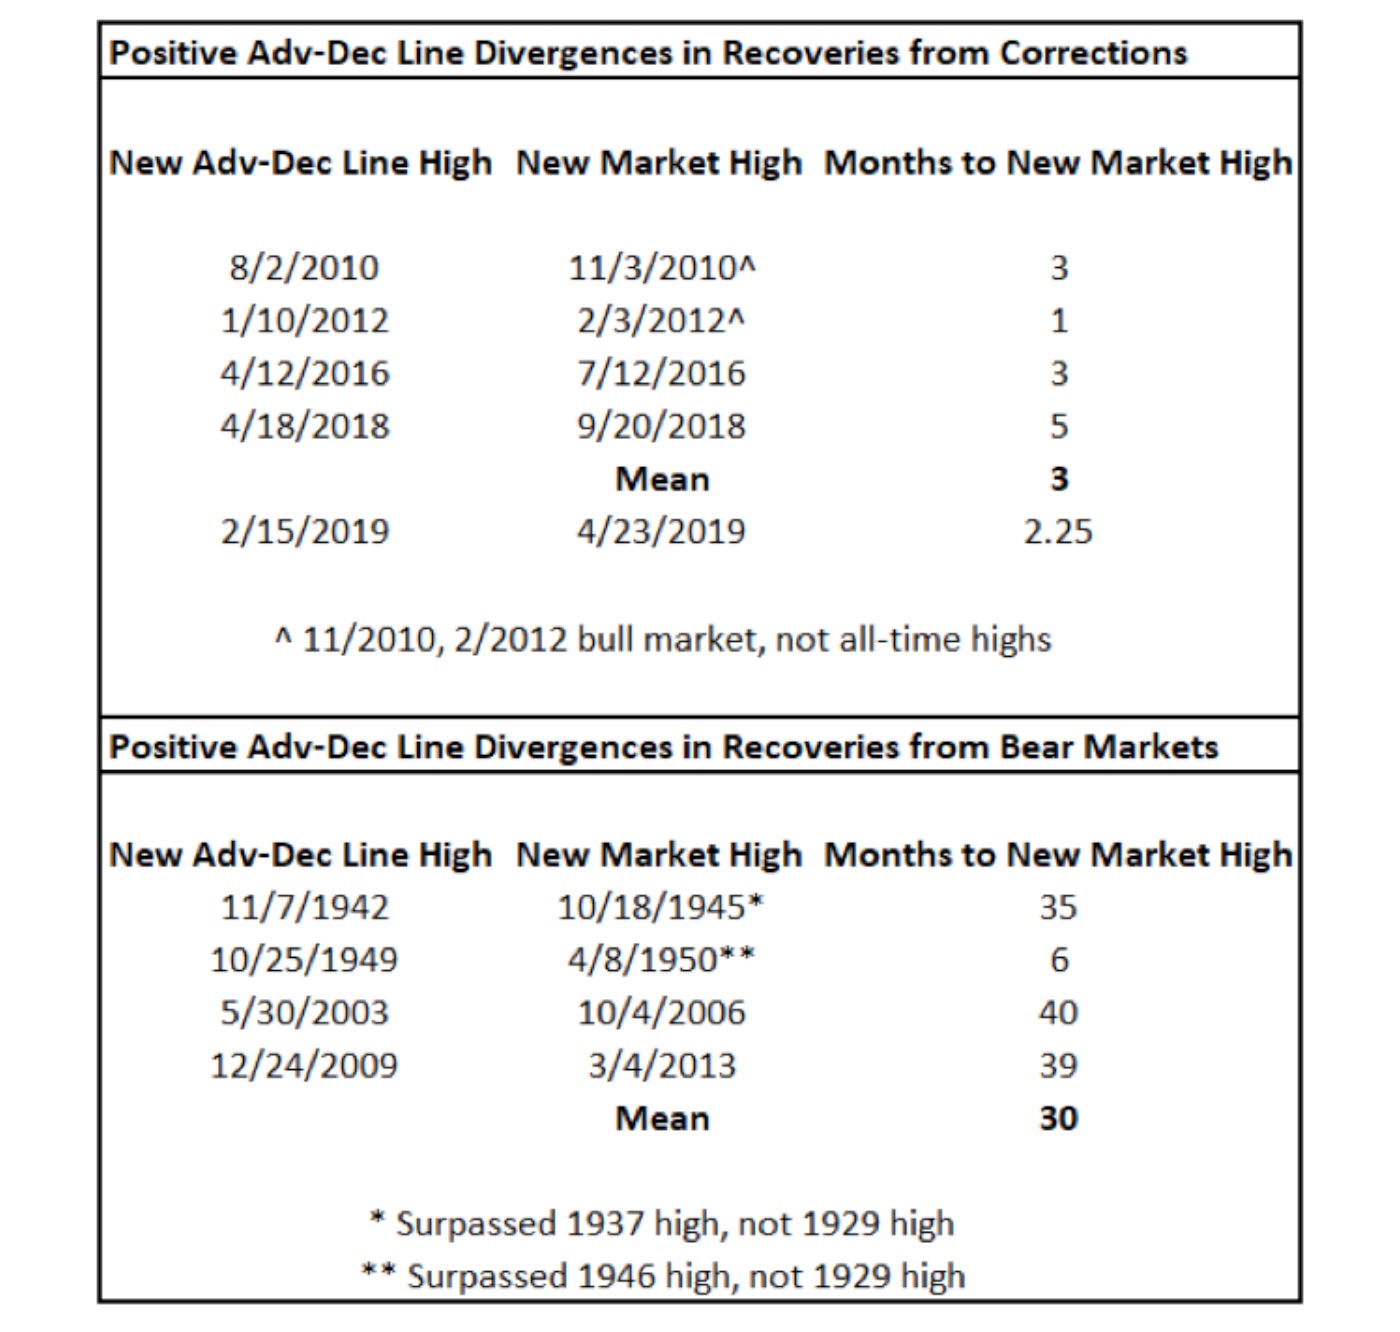
Source: Lowry Research
With our understanding that the Feb. 15, 2019, positive divergence is a post-correction positive divergence, Table 1 allows the closest comparison between similar observations (August 2010, January 2012, April 2016, and April 2018).
From the small sample of four prior occurrences, new bull market or all-time highs for the Dow Jones Industrial Average (DJIA) were achieved between 25 and 156 days after the first new high in the NYSE Advance-Decline Line, with an average of 92 days. Accordingly, these positive divergences that follow market corrections provide early evidence of a continuation of the current bull market, and they should discourage a view that the prevailing market advance is simply a bear market rally.
By contrast, as markets gradually recover from long-lived bear markets, these positive divergences produce much longer lead times. Based on these observations, we have recorded an average of 30 months passing before a reciprocal new market high was achieved. In this way, positive NYSE Advance-Decline Line divergences after long bear markets appear to serve as a confirmation that a new bull market has begun well before new highs in the major price indexes.
The most powerful, recent example of these bullish divergences is depicted in Figure 1.
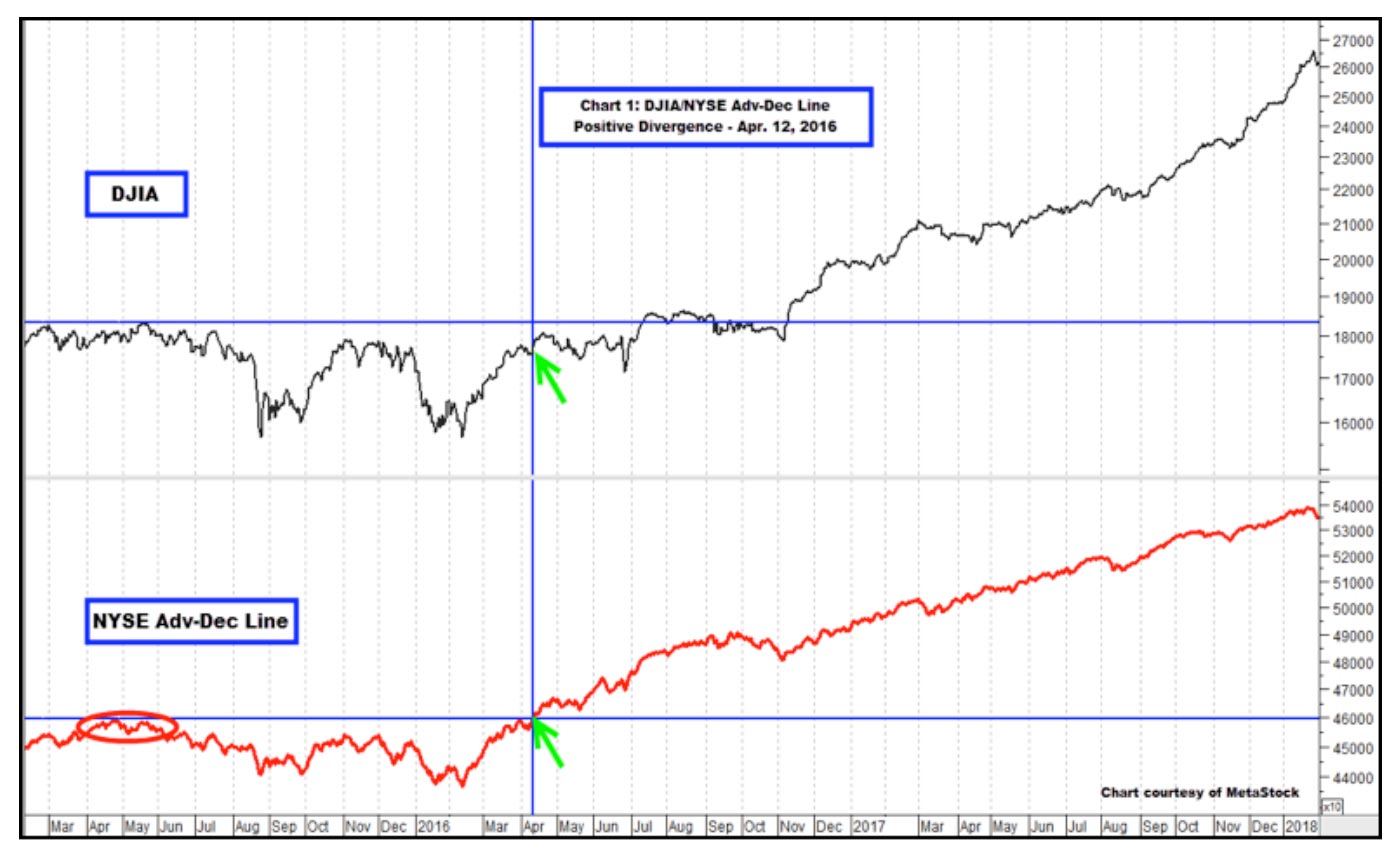
Source: Lowry Research
Here we have illustrated the positive divergence between the NYSE Advance-Decline Line and the DJIA as the Index emerged from the late 2015/early 2016 drawdown.
In order to spot divergences like these, investors should watch for the NYSE Advance-Decline Line to lead prices during the early stages of a recovery, to the eventual point where the NYSE Advance-Decline Line reaches a new all-time or a bull market high ahead of the major price indexes.
In the case of this particular instance, the correction was led by a negative Advance-Decline Line divergence (April 24, 2015, to May 19, 2015). As the DJIA emerged from the correction, the NYSE Advance-Decline Line began leading the price index, with the NYSE Advance-Decline Line ultimately reaching a new all-time high on April 12, 2016, when the DJIA was still short of its respective record high. At that time, the new high in the NYSE Advance-Decline Line indicated that a broad-based, sustainable market rally was underway. It was not until July 12, 2016, that the DJIA finally reached a new all-time high, an achievement it would repeat frequently for the ensuing 18 months.
There are several valuable conclusions to draw based on the limited pool of prior occurrences of positive divergences between the NYSE Advance-Decline Line (all issues) and the major market indexes since 1940:
- Since these observations are historically rare (10 in the last 80 years), they should be paid attention to when they happen.
- With nine of the 10 instances of positive NYSE Advance-Decline Line divergences (90%) leading to new highs, they should be viewed as harbingers of new highs for equity price indexes.
- While positive divergences off major bear market lows suggest a broad-based and sustainable stock market advance is underway, it may still take years until the major price indexes reach new highs.
- These positive divergences serve as an early confirmation that a new bull market has begun well before new highs in the major price indexes.
- Post-correction positive divergences between the NYSE Advance-Decline Line and major market indexes offer more timely indications of future price highs.
- These post-correction bullish divergences provide early evidence of a continuation of the current bull market, and they should discourage a view that the prevailing market advance is simply a bear market rally.
- Given this historical backdrop, the new all-time high in the NYSE Advance-Decline Line on Feb. 15, 2019, demonstrated expansive market breadth and suggested new all-time highs in the major price indexes should follow in the months ahead.
- New price index highs have since been achieved in the S&P 500 Index and NASDAQ Composite.
Finally, the recent confirmatory new highs in the NYSE Advance-Decline Line and S&P 500 Index continue to support the base case of an intact bull market.
 Vincent Randazzo, CMT, is a senior market analyst at Lowry Research with more than 15 years of experience in professional equity market research, technical analysis, and market intelligence. Before joining Lowry, Mr. Randazzo was chief market analyst at NASDAQ. He was also director of research at ICAP and a research salesperson at Morgan Stanley and UBS. He has been a Chartered Market Technician (CMT) since 2008. For more information on Lowry Research, please visit lowryresearch.com.