


We are now more than four months into the rebound off the Dec. 24, 2018, low. It is a natural question to wonder if the uptrend is going to continue, or whether instead the major averages are going to stop around the level of the prior highs. The following chart offers some useful clues about which answer applies this time.
Here is the short version: Gobs of market breadth is a good thing.
Now here is the longer explanation: When the NYSE’s Advance-Decline Line is strong for a long period, it produces high readings for the McClellan Oscillator. That, in turn, pushes up the McClellan Summation Index, which changes each day by the value of the Oscillator, which means that more big positive Oscillator days will help to push up the Summation Index to a high level.
The following chart shows the Ratio-Adjusted Summation Index (RASI), which differs from the original classic version in that it factors out the changing numbers of issues traded over time. For a deeper explanation of the math, see this article.
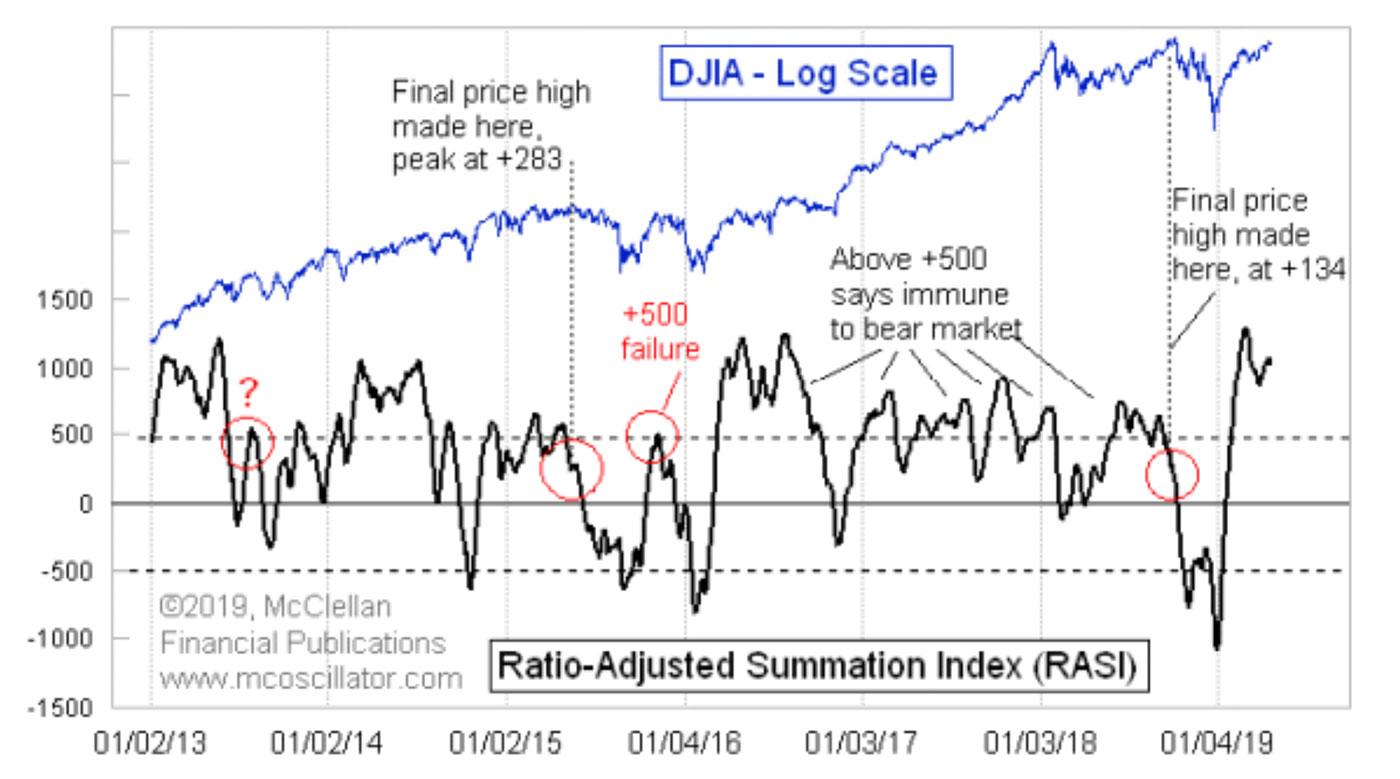
Source: McClellan Financial Publications, data as of 4/24/19
What matters right now is that the ability of the RASI to climb up to a nice lofty value conveys an important message. It says that liquidity is plentiful and likely to be for a while longer. A high RASI reading says that there is still more uptrend yet to come. There might be an ordinary, garden-variety correction to help restore equilibrium, but we are not at the end point for the uptrend.
Final price highs do not typically arrive with the RASI up above 500. The time to worry is when we are seeing prices moving to new all-time highs but the RASI is down below 500. This is especially important when the RASI falls below 500 due to a normal correction and then fails to climb back above 500 on the ensuing rally. That is a big invitation to trouble.
But it is not at all what we are seeing now. The RASI is up at 1005 as of April 24, 2019, so it is a long way from signaling a problematic loss of liquidity for the stock market. An ordinary correction can still appear at any time, and we have to accept that and be ready for it, but this is not the end of the uptrend. And that is a very nice piece of information to obtain from the market.
Editor’s note: Please see links in the article for further descriptions of the McClellan Oscillator and the McClellan Summation Index.
The opinions expressed in this article are those of the author and do not necessarily represent the views of Proactive Advisor Magazine. These opinions are presented for educational purposes only.
A version of this article was first published by McClellan Financial Publications on April 25, 2019.
 Tom McClellan is the editor of The McClellan Market Report newsletter and its companion, Daily Edition. He started that publication in 1995 with his father Sherman McClellan, the co-creator of the McClellan Oscillator, and Tom still has the privilege of working with his father. Tom is a 1982 graduate of West Point, and served 11 years as an Army helicopter pilot before moving to his current career. Tom was named by Timer Digest as the #1 Long-Term Stock Market Timer for both 2011 and 2012. mcoscillator.com