


Hopefully, you have been participating in the current 15% run in the S&P 500.
Unfortunately, many investors haven’t been jumping on the equity bandwagon. According to strategists, investors have pulled $91 billion from equity funds this year, and that is on top of the $148 billion pulled out near December 2018’s lows. That’s nearly a quarter of trillion dollars that has missed out.
The question is, should investors take their gains and join the exodus, or is the smart move to stick with the rally and expect even more gains to come?
History suggests the latter—stay bullish. We examine four different rationales supporting further gains in this market.
4 POTENTIAL 2019 GOALS FOR THE S&P 500 INDEX
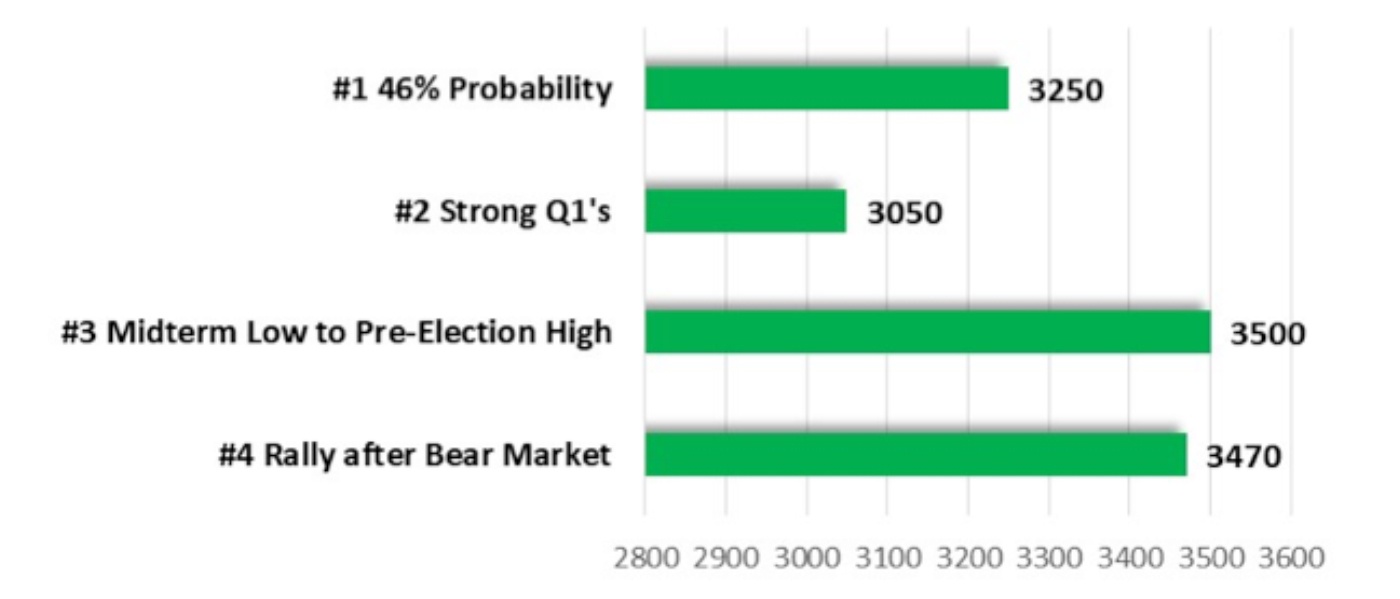
Source: STIR Research
- There is a 46% probability of a 20%-plus gain in 2019. Looking back at the annual S&P 500 returns in secular bull markets (1949–1968, 1982–2000, and 2011–current), a total of 46 years, in 21 of those years (46%) the gains surpassed 20%, with an average gain of 30.1%. That would push the S&P 500 above 3,250 in 2019. The data also shows that secular bull markets have never experienced two consecutive down years. On a historical basis, this makes it unlikely that 2019 will end up in the negative column like 2018.
- The strongest Q1 in two decades points to a surge higher. Since 1950, there have been only 10 times when the S&P 500 has been able to rack up a 10% gain or better in the first quarter. But that wasn’t the end of the gains. In nine out of 10 cases, the market continued to tack on even more gains. The median gain for those years was 21.6%, giving the market a goal this year of 3,050 for the S&P 500. The one case when the market closed at a level below the Q1 gain was 1987. That year included the infamous crash and bear market in the fall. We experienced a bear market last year, and it would be unlikely for another bear market to occur so soon.
- Does 3,500 sound even better for the S&P 500 this year? History suggests that is very possible. Going back 70 years and looking at the average gain from the midterm-election-year low to the pre-election-year high in secular bull markets, the average gain has been 48.9%. We hit the midterm-election-year low on Dec. 24, 2018, when the S&P 500 dropped to 2,351. Add on an average gain of 48.9% and the high for the pre-election year becomes 3,500!
- Market rallies following bear markets. Can we expect a 40% gain for the S&P and 62% for the NASDAQ off the Dec. 24, 2018, low? Going back 61 years and looking at 13 past bear market declines of over 19% for the S&P 500, the market has gained, on average, 38.7% over the following 12 months. That would put the S&P 500 at 3,470. History for the NASDAQ Composite isn’t as lengthy, but in the six prior cases of declines greater than 19% over the past 31 years, the gain one year later was over 62%, or a move above 10,000.
History tells us that a market meltup may be in the cards. “FOMO,” fear of missing out, will come into play as overly pessimistic investors who have stayed on the sidelines may ultimately be forced to put their cash back in the market, lest they be left behind.
 Marshall Schield is the chief strategist for STIR Research LLC, a publisher of active allocation indexes and asset class/sector research for financial advisors and institutional investors. Mr. Schield has been an active strategist for four decades and his accomplishments have achieved national recognition from a variety of sources, including Barron's and Lipper Analytical Services. stirresearch.com