The first-quarter 2026 earnings season for S&P 500 companies produced broad year-over-year growth in both earnings and revenue. With most companies having reported, aggregate earnings are tracking close to 29% above the prior-year period, while revenue growth is running above 11%. A large majority of companies also reported earnings above analyst expectations, with late-season data showing more than 83% of reporting S&P 500 companies exceeding consensus earnings-per-share (EPS) estimates.
The earnings results came against a backdrop of several macroeconomic and geopolitical headwinds, including the conflict involving Iran, elevated oil prices, persistent inflation concerns, higher Treasury yields, tariff-related cost pressures, and continued uncertainty around Federal Reserve policy. Despite those factors, reported earnings growth remained well above expectations that were in place at the start of the reporting season.
The strongest earnings growth has been concentrated in several large sectors and industry groups. Technology, communication services, and select consumer discretionary companies were notable contributors, with results supported by continued demand tied to artificial intelligence infrastructure, cloud services, digital advertising, and related capital spending.
At the same time, several other sectors also reported year-over-year profit improvement. However, results continued to vary by sector and company, with investors responding more favorably to companies that combined earnings beats with constructive guidance.
The Q1 results also led to higher full-year earnings estimates for the S&P 500.
Reuters reported that 2026 earnings expectations had risen for the remaining quarters of the year, alongside stronger-than-expected first-quarter results. Reuters noted, “Future projections are also growing rosier: Analysts’ estimates for future 12-month U.S. earnings have risen by over 10% since the start of the year, according to LSEG Datastream.”
With Technology among the leaders in Q1 earnings growth, investors rewarded the sector with commensurate stock gains.
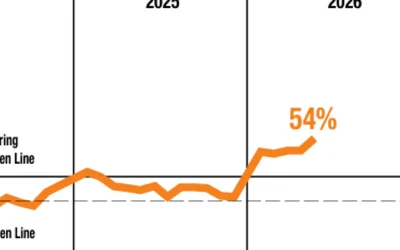
Bespoke Investment Group recently wrote about the sector’s outsized gains:
“After gaining 17.4% in April, the S&P 500 Technology sector gained 16% in May for a total two-month gain of 36.1%. April and May was the third strongest two-month gain for Tech since 1990 and just the sixth time the sector has seen back-to-back monthly gains of more than 10%. …
“We haven’t seen a move like this since the first two months after the Financial Crisis bottom, and before that, we only saw it a handful of times in the late 1990s and early 2000s.
“While not a guarantee, we’d be surprised if we don’t see a near term pause in the rally at least for a month or two.”
FIGURE 1: S&P 500 TECHNOLOGY SECTOR MONTHLY PRICE CHART
(LOG SCALE) (1989–PRESENT)

Source: Bespoke Investment Group
![]() Related Article: New Fed chair will be greeted by inflation and economic growth
Related Article: New Fed chair will be greeted by inflation and economic growth
Highlights for Q1 2026 earnings to date
In its May 29 Earnings Insight, FactSet shared several key metrics on earnings progress for Q1:
- “Earnings Scorecard: For Q1 2026 (with 97% of S&P 500 companies reporting actual results), 85% of S&P 500 companies have reported a positive EPS surprise and 81% of S&P 500 companies [have] reported a positive revenue surprise.
- “Earnings Growth: For Q1 2026, the blended (year-over-year) earnings growth rate for the S&P 500 is 28.6%. If 28.6% is the actual growth rate for the quarter, it will mark the highest earnings growth rate reported by the index since Q4 2021 (32.0%).
- “Earnings Revisions: On March 31, the estimated (year-over-year) earnings growth rate for the S&P 500 for Q1 2026 was 13.1%. Ten sectors are reporting (or have reported) higher earnings today (compared to March 31) due to positive EPS surprises and upward revisions to EPS estimates.
- “Earnings Guidance: For Q2 2026, 46 S&P 500 companies have issued negative EPS guidance and 56 S&P 500 companies have issued positive EPS guidance.
- “Valuation: The forward 12-month P/E ratio for the S&P 500 is 21.2. This P/E ratio is above the 5-year average (19.9) and above the 10-year average (18.9).”
FIGURE 2: S&P 500 EARNINGS GROWTH (Y/Y) (Q1 2026)

Source: FactSet
FactSet also noted that analysts increased second-quarter earnings estimates despite concerns about higher oil and gas prices:
“Given concerns in the market about higher oil and gas prices, have analysts lowered EPS estimates more than normal for S&P 500 companies for the second quarter?
“The answer is no. During the months of April and May, analysts increased EPS estimates for the second quarter. The Q2 bottom-up EPS estimate (which is an aggregation of the median EPS estimates for Q2 for all the companies in the index) increased by 2.5% (to $80.80 from $78.84) from March 31 to May 28. …
“The second quarter marks the largest increase in the bottom-up EPS estimate during the first two months of a quarter since Q3 2021 (+3.8%).”
FIGURE 3: CHANGE IN S&P 500 QUARTERLY EPS
(FIRST 2 MONTHS OF QUARTER)

Source: FactSet
RECENT POSTS