


Lowry’s Short Term Index is our proprietary short-term measure of investors’ demand for equities. Typically, this indicator oscillates between 60 and the low 90s. While readings of 60 or below are historically considered oversold, the gauge is unbounded to the upside, though it has reached above 110 only on rare occasions.
The recent explosion in our Short Term Index—from 59 on December 24, 2018, to 103 on January 18, 2019—along with the 13.6% gain in the S&P 500 Index over the same time frame, has led many to question what this means for the sustainability of the current market rally.
To gain the historical perspective necessary to address this concern, we examined market data from 1940 to the present. Specifically, we cited comparable instances of robust short-duration expansions in the Short Term Index and then recorded the S&P 500 Index’s condition one month, three months, one year, and two years after the Short Term Index’s initial observation low. With the recent rise in the Short Term Index of 44 points in just over three weeks, we used a 40-point gain from oversold levels (< 60) in less than a month as factors to identify similar instances for backtesting.
Excluding the current observation, this set of criteria has been met only nine times over the course of 80 years.
Complete results are provided in Table 1. Apart from the first occurrence, which was contained in the 1937–1942 bear market and was immediately preceded by a vertical one-month, 26% drop, each of the other observations represented significant intermediate-term market bottoms. Another key distinction of the 1940 observation is that it was the only one that did not coincide with a new intermediate-trend buy signal based on the movement of Lowry’s Buying Power and Selling Pressure Indexes—our intermediate-term measures of investors’ demand and supply. Of all observations, despite an average one-month gain of nearly 10%, the S&P 500 Index was still higher by 30.1% one year later and 45.1% higher two years later, on average.
TABLE 1: HISTORY OF RAPID EXPANSIONS IN LOWRY’S SHORT TERM INDEX
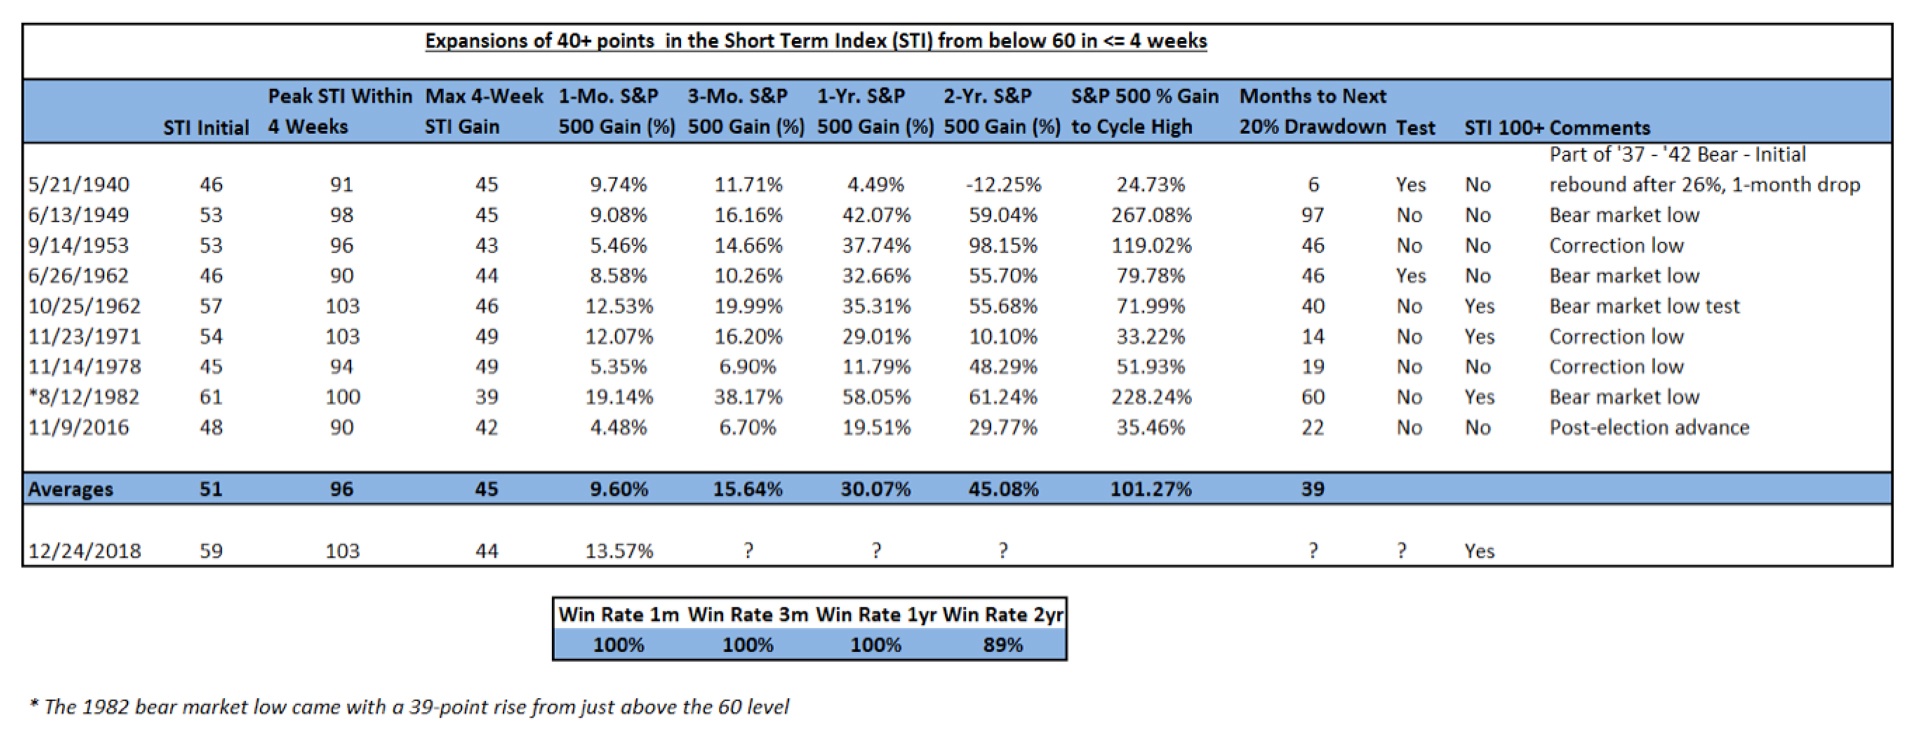
Click Image to Enlarge
Source: Lowry Research
The point is that these relatively quick bursts of strong demand do not know an “overbought” bound. Rather, these conditions are historically consistent with the accurate identification of lasting market lows and new intermediate-term to long-term uptrends.
To further this point of a significant, sustained market low, we included a column that measures the time to the next 20% drawdown, which was 39 months, on average.
From a similar perspective, cognizant of the fact that stock markets do not abide by specific arbitrary time parameters (e.g., one month, three months, one year, two years), we also measured the percent gain in the S&P 500 to its “cycle high,” or the last high, before the first 20% drawdown.
Finally, it should be noted that, aside from the 1940 occasion, there was only one test of the low—in October 1962—which ultimately confirmed the June 1962 end to the December 1961–June 1962 bear market. The context of that singular test is important to understand since it was news-driven, representing the peak of anxiety during the Cuban missile crisis. So, for those waiting for a significant decline or a test of the December 2018 low to buy, probabilities are historically against a market test given these rare circumstances.
 Vincent Randazzo, CMT, is a senior market analyst at Lowry Research with more than 15 years of experience in professional equity market research, technical analysis, and market intelligence. Before joining Lowry, Mr. Randazzo was chief market analyst at NASDAQ. He was also director of research at ICAP and a research salesperson at Morgan Stanley and UBS. He has been a Chartered Market Technician (CMT) since 2008. For more information on Lowry Research, please visit lowryresearch.com.