Will 20th-century investment strategies meet 21st-century longevity needs?
Will 20th-century investment strategies meet 21st-century longevity needs?

This century’s advanced health care is expected to help increase life expectancies by many years. Will 20th-century lifestyle and target-date strategies meet the investment needs of an older, expanded retiree population?
Some years ago, CBS News featured a striking headline: “Most Babies Born Since 2000 Will Hit 100.” The article presented a solid argument that included insights from David Gems, an expert in aging at University College London, who noted, “Improvements in health care are leading to ever slowing rates of aging, challenging the idea that there is a fixed ceiling to human longevity.”
A 2020 Wall Street Journal headline asked, “Is 100 the New Life Expectancy for People Born in the 21st Century?” Professor Steven N. Austad, a biologist at the University of Alabama at Birmingham, was quoted as saying that by 2150, advances in biomedical science and cellular-function-enhancing drugs “would make living to 100 routine, with a few people reaching the age of 150 years—somewhat like people routinely live to age 80 today with a few people living to 110.”
There seems to be little doubt from forecasters that life spans for those born after 2000 will continue to lengthen—likely at a faster rate than last century.
However, there is also good news for those born in the previous century.
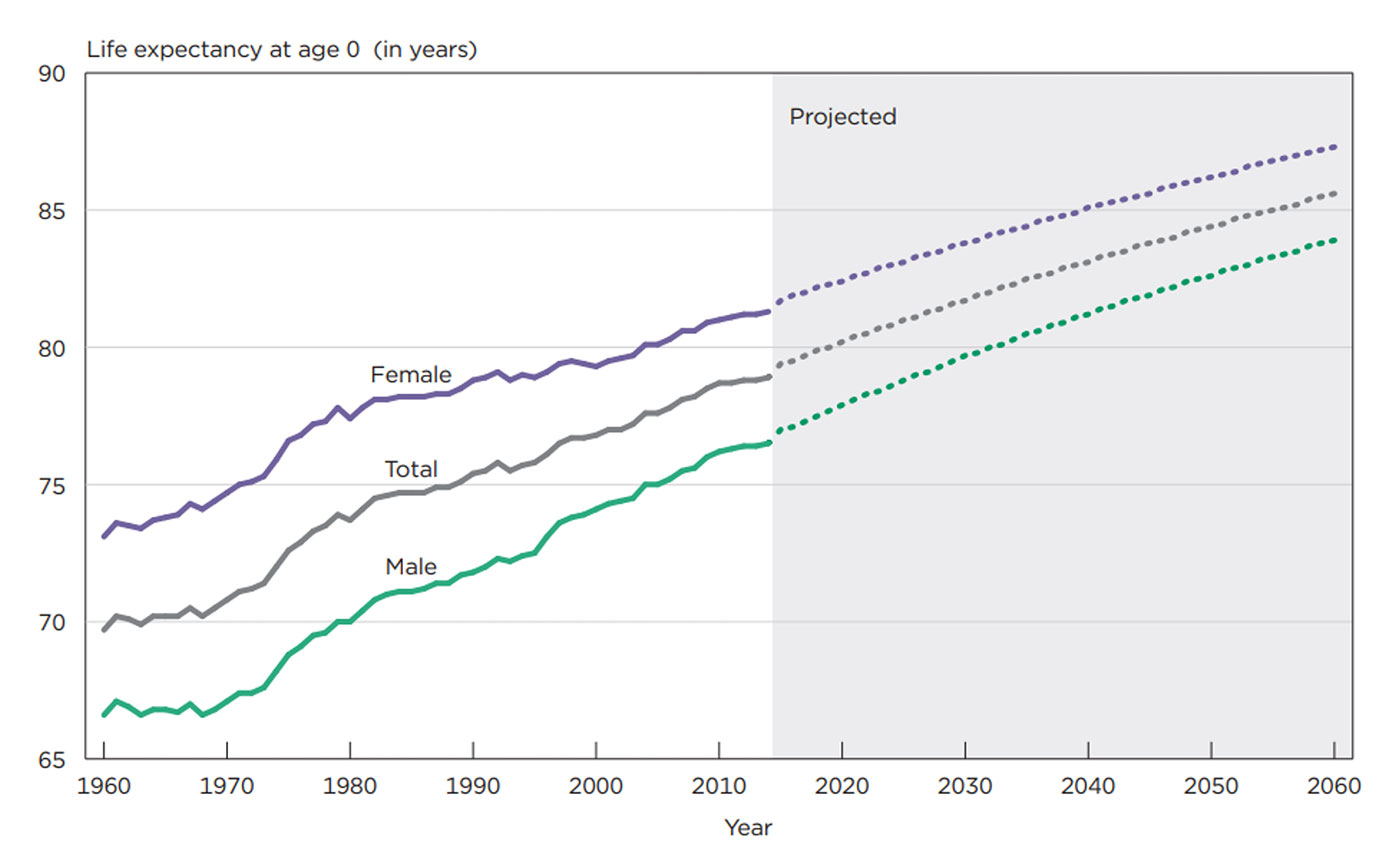
According to the Wall Street Journal piece, “During the 20th century, life expectancy in the U.S. surged some 63%, to 77 years from 48.” More recent data pegs U.S. life expectancies now at just over 79 years—despite the significant impact of the COVID pandemic. However, as Figure 1 shows, there is a distinct and enduring gap between female and male life expectancies.
FIGURE 1: HISTORICAL AND PROJECTED LIFE EXPECTANCY FOR THE TOTAL U.S. POPULATION AT BIRTH (1960–2060)

Sources: U.S. Census Bureau; 2017 National Population Projections, 2015–2060; and National Center for Health Statistics Life Tables, 1960–2014
Not only will we be living longer on average, but we will also experience better health. This will give us more time and ability to travel, enjoy hobbies, fulfill bucket-list wishes, and visit children and grandchildren (and even great-grandchildren). All of this accentuates the need for larger retirement nest eggs.
The bad news is that the ratio between the years spent accumulating wealth and those spent harvesting it is shrinking. Not that long ago, individuals and couples typically had around 40 years (ages 25 to 65) for wealth accumulation, followed by 10 to 15 years for wealth harvesting, a ratio of about 4-to-1.
With significant increases in life expectancy, the traditional 40-plus years of wealth accumulation remains the same, but people now face a potential 15 to 40-plus years of wealth harvesting. That 4-to-1 ratio might decrease to a 1-to-1 ratio during this century.
Examining the longevity data leads me to think the old Wall Street adage about “time in the market” might be potentially misleading for current and future investors. Why?
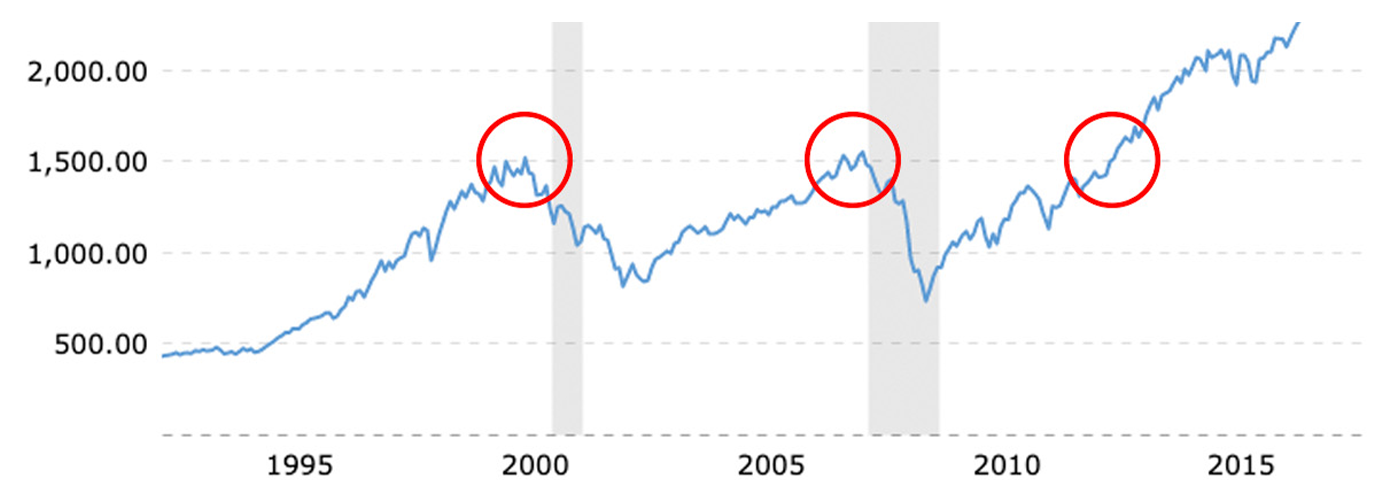
Investors no longer have the luxury of “wasting” time. They need to focus on maximizing returns during their wealth-accumulation years and minimizing time spent recovering from portfolio drawdowns. This was exemplified by the “lost decade” seen early in this century. Following two major crashes, the S&P 500 didn’t return to its 2000 levels until 2013. The NASDAQ 100 Index, which suffered even steeper drawdowns than the S&P 500, took even longer to reach “breakeven” (Figure 2).
According to Yardeni Research, the S&P 500 has seen 12 significant corrections or bear markets since 2000, with the steepest drawdowns coming in at 56.8%, 49.1%, 33.9%, and 25.4%.
FIGURE 2: HISTORICAL VIEW OF THE S&P INDEX (1993–2015)

Note: Shaded areas are recessions.
Source: MacroTrends
Understanding market cycles is crucial in this context. Looking at 100 years of history, the stock market (the main driver of wealth accumulation) has spent half of the time in secular markets. These are long-term trends that last decades, alternating between secular bear markets (characterized by negative returns) and secular bull markets (where wealth is built). For instance, the 18-year secular bull market from 1982 to 2000 saw a gain of over 1,400%. Conversely, the 12-year secular bear market from 2000 to 2011 witnessed a loss of 28%.
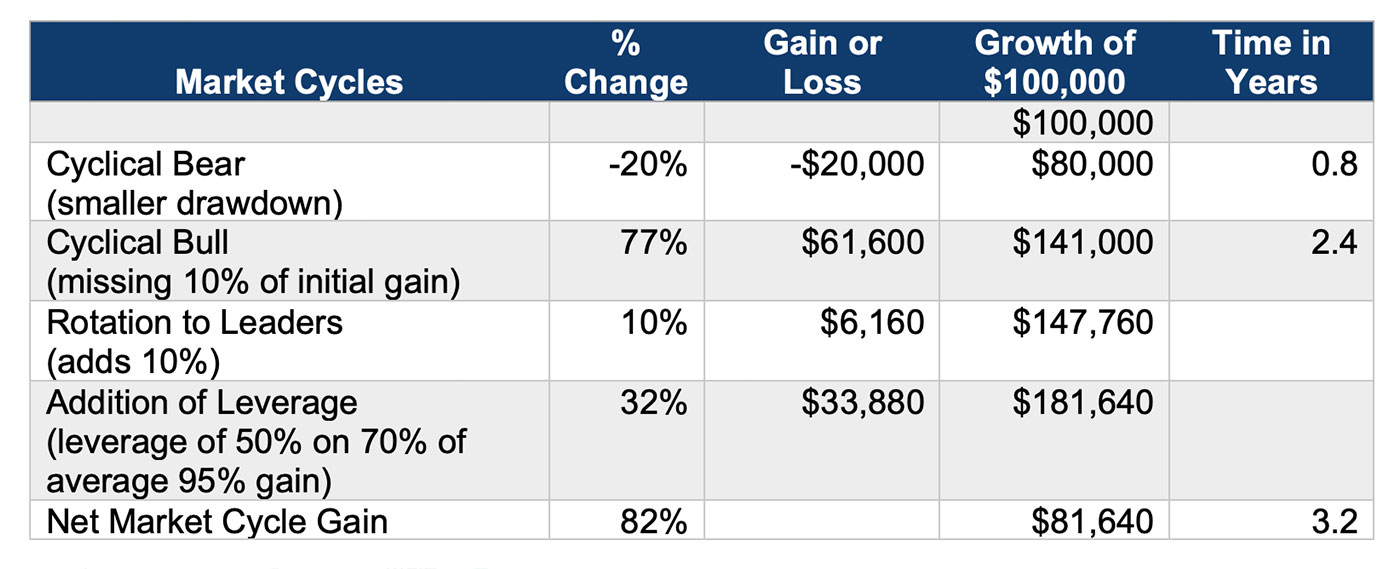
The trend of a secular market doesn’t follow a straight line up or down; these markets comprise shorter cyclical bull and bear markets that can last from a few months to several years. Over the past 100 years, the stock market has experienced 30 cyclical bull markets and 30 cyclical bear markets (note that the data in the following table does not include the current bull market).
Analyzing the cyclical market cycle reveals that, on average, the market spends 2.4 years in an uptrend and 0.8 years in decline. Part of the 2.4-year uptrend is often dedicated to recouping previous losses. In simple terms, the typical market cycle involves two years of accumulating wealth and one year experiencing declining prices and then recovering those losses.

Source: STIR Research
Typical 20th-century buy-and-hold equity strategies with a fixed allocation will ride the cyclical bear down and then participate in the cyclical bull advance, capturing a net 35% equity gain on average.
The reality of market cycles, coupled with the decreasing ratio of years spent accumulating wealth to those harvesting it (potentially reaching 1-to-1 in the future), makes it evident that traditional 20th-century investment allocations for retirement planning will not work for the longevity needs of the 21st century.
- Advisors and their clients should strive to reduce portfolio losses during periods of significant market drawdowns. Instead of suffering an average 32% loss in bear market conditions, requiring a 47% gain to recover, use risk-management indicators to contain losses to 15%–20%. Achieving this means only 18% to 25% of the next bull market will be dedicated to “getting back to even.” But recognize that risk-managed strategies come with a trade-off. By reducing market exposure in falling markets, investors will inevitably miss some early gains when a new bull market begins.
- Instead of investing across the entire market, an investor should strive to maintain a diversified client portfolio but focus on owning the leaders. Leadership changes from one bull market to the next. For example, during the 2002–2007 bull market, Emerging Markets gained over 400% and Developed Countries were up over 200%, compared to a 100% gain for the S&P 500. However, this pattern reversed during the 2011–2018 bull market: The S&P 500 led with a 167% gain, while Developed Countries rose just 82% and Emerging Markets gained only 44%.
A strategy of rotating into the leaders can have a major impact on returns. This was evident when the NASDAQ and Technology stocks led from 1998 to 2000, and again from mid-2020 through 2021. The same applies to International stocks from 2002 to 2009. While this approach may sometimes require considerable effort with little impact, my experience suggests that in an average market cycle, a leadership-rotation strategy can add 10 percentage points or more to portfolio performance.
- Judiciously increase market exposure during bull market runs. Yes, consider adding some leverage, at levels of 40%, 50%, or even 100%. The market spends over 70% of its time rising, and investors can use that to their benefit. It is effectively like adding more years to the wealth-accumulation ratio.
Although it’s impossible to buy at the exact bottom or sell at the exact top, many timing signals can capture up to 70% or more of the market’s advance. From my experience, during lengthy bull runs, the additional leverage can have a compounding effect. For example, in a typical 95% bull run, employing 50% in leverage for 70% of the entire run would increase the return by an additional 32% (95% return x 70% participation x 50% leverage).
Adding active management to a market cycle can add value, as the following table illustrates. The future will continue to see market cycles; the goal is to make each cycle more productive.
TABLE 2: GROWTH OF $100,000 IN AN ACTIVELY MANAGED EQUITY STRATEGY DURING A TYPICAL MARKET CYCLE

Source: STIR Research
Bottom line: The fixed allocation found in many of today’s life-cycle and target-date funds will simply not meet the needs of investors living increasingly longer, healthier lives. Investor clients would be better served by an active allocation that aims to finance a longer, more expensive retirement.
As life spans extend, investment time horizons will start to stretch into multiple decades. A 30-year-old investor could experience over 21 market cycles with conceivably a 70-year investment time horizon. And for a 50-year-old investor, 15 market cycles might be the norm.
Active management doesn’t guarantee top-tier performance in every market cycle. Reflecting on my experience as part of a firm managing various active strategies over 15 different market cycles, there were many where we excelled in navigating either the bear or the bull phase, but not both.
Here’s how I’d grade our performance in recent market examples:
- The 2007–2009 bear market: A+; the following bull: A.
- The 2020 sharp bear market: B; the following bull market: A.
- The 2022 bear market: D, due to too many short-term whipsaws.
A perfect record is rare indeed, and it’s unrealistic to expect an active strategy to consistently deliver outstanding performance throughout every market cycle. However, over the long term, active strategic allocations that make the most of every market cycle can offer a very viable investment solution for the longevity needs of retirees today and into the future.
The opinions expressed in this article are those of the author and the sources cited and do not necessarily represent the views of Proactive Advisor Magazine. This material is presented for educational purposes only.
 Marshall Schield is the chief strategist for STIR Research LLC, a publisher of active allocation indexes and asset class/sector research for financial advisors and institutional investors. Mr. Schield has been an active strategist for four decades and his accomplishments have achieved national recognition from a variety of sources, including Barron's and Lipper Analytical Services. stirresearch.com
RECENT POSTS


