


Since we are at the inception of a new year and a new decade (if you adhere to the notion that the decade begins with 2020 and not 2021), it is sometimes useful to see how the patterns of previous market years have played out.
Figure 1 is a composite of all years ending in “9” compared to the “average” market year.
The orange line shows how the “average” of all stock market years has performed for the Dow Jones Industrial Average (DJIA). The blue line depicts the performance only of years ending in “9,” and you can see that it is strong. Typically, there is a decline early in the year (January–February), and then it’s off to the races for the remainder of the year—with minor corrections in May–June and September–October.
The year that just concluded (2019) didn’t fit that pattern exactly, but it was certainly a very bullish year. In 2019, there was a strong rally at the beginning of the year, not a decline—but there were minor corrections in May and August–September.
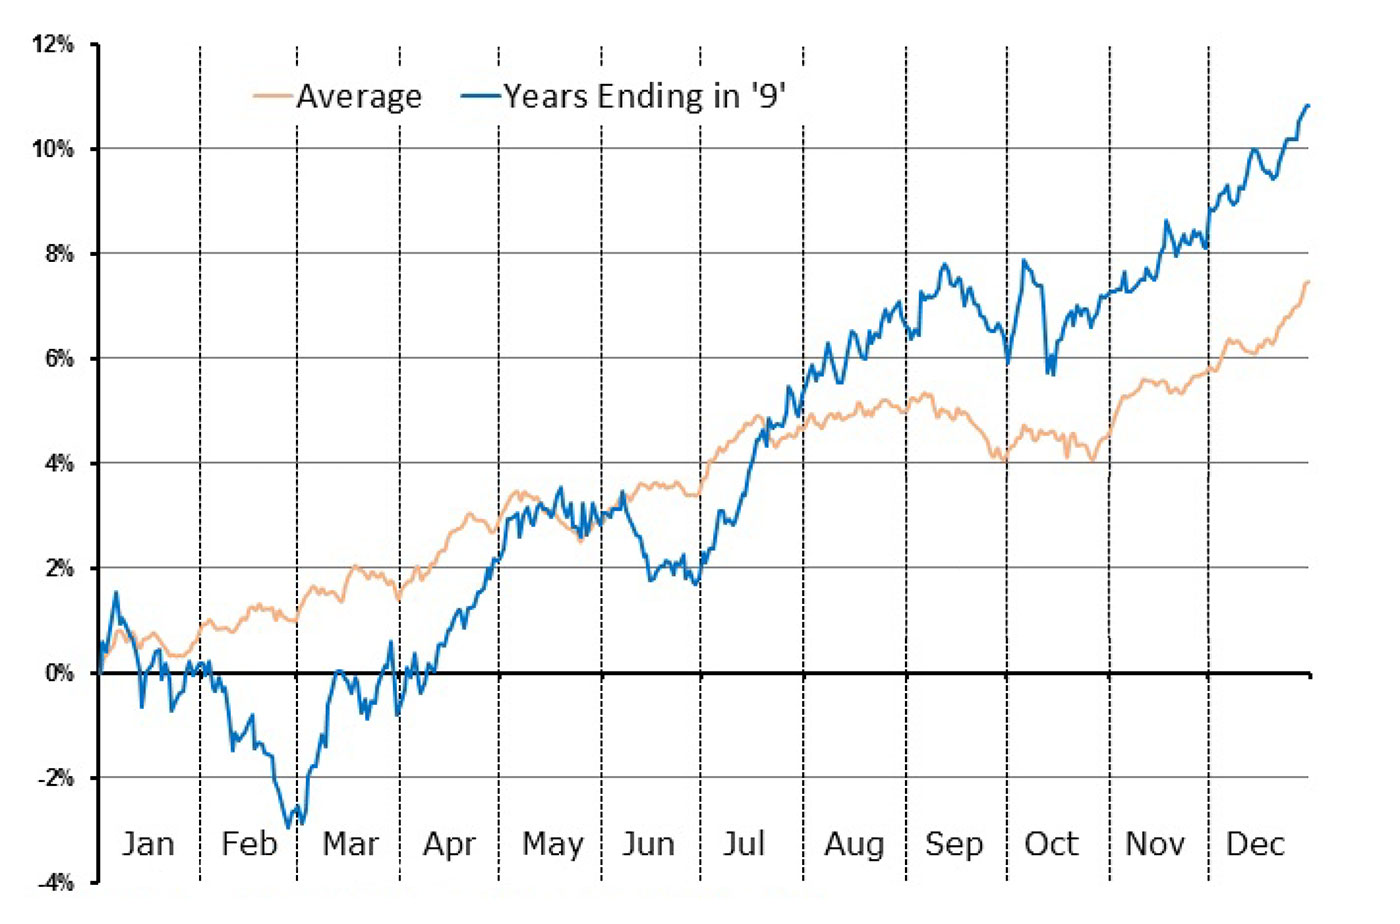
Source: McMillan Analysis Corp., EquityClock.com
Figure 2 depicts the average performance of years ending in “0” (blue line; the orange line is the same as in Figure 1) compared to the “average” market year.
You can see that the market has struggled in years ending in “0.” Historically, there is a sharp decline in January, followed by another decline in April–May, leading to the lows of the year. But the rally from there is a weak one, and it’s not until December that the market finally registers gains for the year.
The most recent year ending in “0” was 2010.
Again, it didn’t match the “average” year exactly, but it wasn’t far off: There was a decline in January, followed by a rally to new highs into April, but then the market declined sharply in the April–June time frame (which included the “flash crash”), with the yearly lows coming in late June. Those lows were the lows for the ensuing decade, by the way. From there, the rally was much stronger than the “average” year, as the market went on a bullish run from late August 2010 onward.
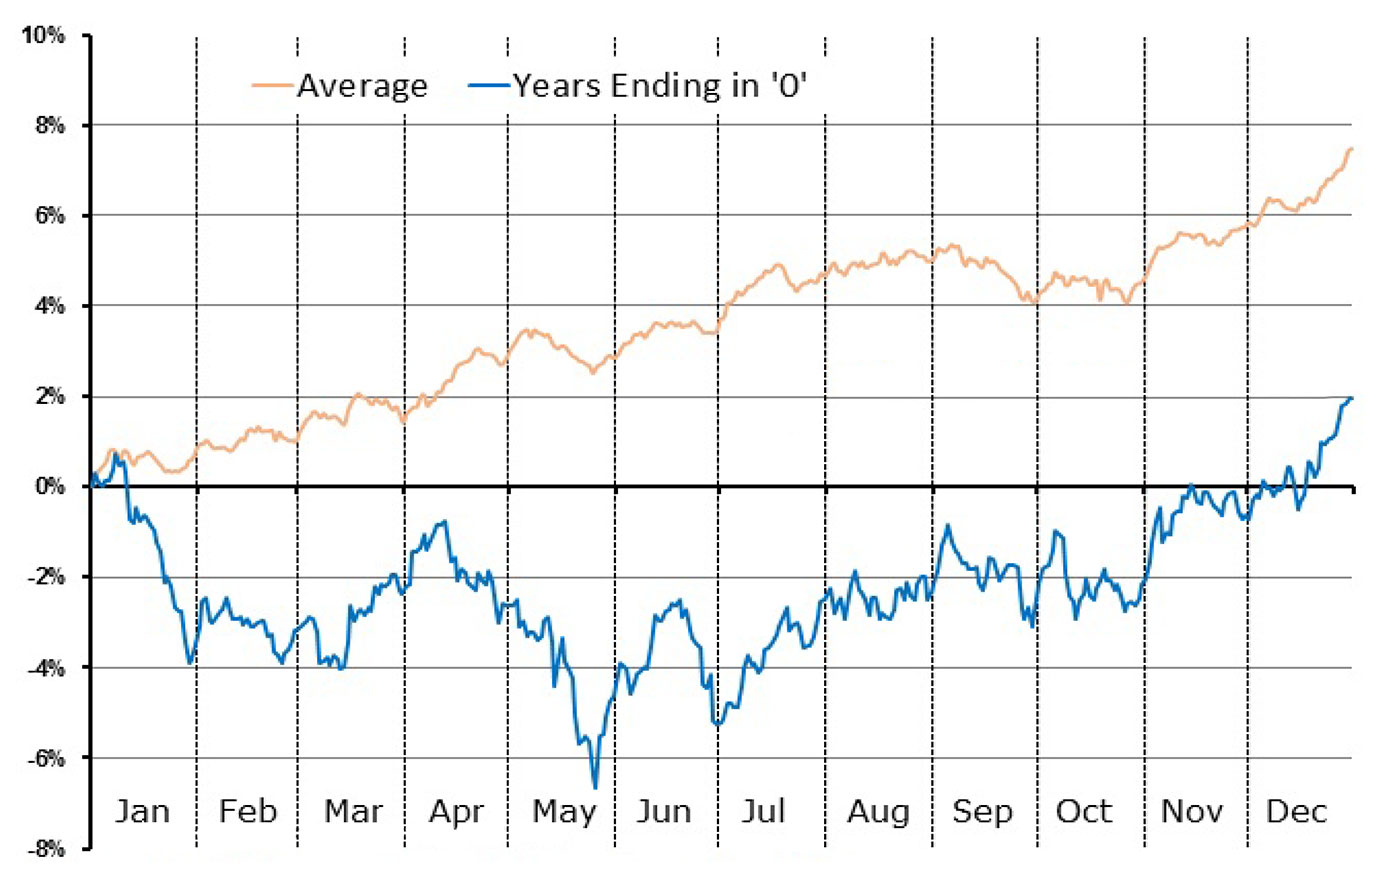
Source: McMillan Analysis Corp., EquityClock.com
There are summaries of the entire 10-year cycle available on the internet. Typically, the market struggles in year “0” and “1,” finally bottoming in year “2.” Then the market rallies more or less continuously, with years ending in “5” being extremely strong.
So, by these cyclical patterns, the market might have some trouble for a year or two (2011 was a rather unpleasant year for the stock market—especially from August through November). But then the inevitable bullish scenario took over once again. Going back to the 1880s, the low price for the decade came in year “0,” “1,” or “2” in nine of the 14 decades. The latest in the decade that the low was reached was in 2009, after the financial crisis had occurred.
Another cycle that technicians often discuss is the “four-year cycle,” or the “presidential cycle,” which are the same thing in my opinion.
We are entering the fourth year of the presidential cycle. The theory is that the market moves somewhat in relation to the presidential election cycle. In year one, the market might decline, as the new president enacts tougher legislation, figuring that the public will forget about it by the time the next election comes around—three years hence. The second year can also be a difficult time for stocks, but there is usually a bottom late in the year that carries the market higher into and throughout the third year. Then, in the fourth (election) year, the financial spigots are opened as the president tries to get re-elected or to keep his or her political party in power.
That causes the market to rise sharply. Having said all of that, the presidential cycle has been off in some cases. For example, 2008 was a very bearish year, when it was supposed to be a bullish one. However, 2012 was bullish. But 2016 had a rough beginning but bottomed in February. From there, it was tenuous going into the election, but then it rallied strongly after President Trump was elected. Since 2020 is an election year, its positive presidential-cycle tendencies might overcome the usual negativity of years ending in “0,” but perhaps not until later in the year.
One last point. The “four-year cycle” has historically produced a strong market bottom in the even year in nearly every four-year cycle: 1962, 1966, 1970, and through 1990. That is, there was a rather strong market decline—a bear market—into those bottoming years. Since then it’s been more sporadic, but in 2002 and 2010, the market had declined strongly before bottoming (technically, 2009 was “the” bottom, but the flash crash made 2010 into another bottom). Since then there haven’t been any declines with staying power, and so while there were sharp declines into very tradeable bottoms in 1998, 2006, 2014, and 2018, they were not preceded by bear markets.
So, is the bear market a thing of the past? Have “permanently” low interest rates and passive investing cleared the way for ever-rising prices, with just the occasional pullback of a month or two? In theory, one would say “no,” but the reality is that even Keynes couldn’t have imagined that pushing interest rates to zero and keeping them there would have worked out so well.
What could cause a “real” bear market? Most likely, an increase in interest rates. We saw in the last quarter of 2018 how pouty the market became when the Fed raised rates modestly—at a far slower rate than past decades have seen. It now seems everyone is kowtowing to the zero-interest-rate philosophy (even the Fed chief, if he wants to keep his job). But, eventually, this is where a problem will develop for the stock market.
The opinions expressed in this article are those of the author and do not necessarily represent the views of Proactive Advisor Magazine. These opinions are presented for educational purposes only.
This is an edited version of an article that was first published at optionstrategist.com on Jan.3, 2020.
 Professional trader Lawrence G. McMillan is perhaps best known as the author of “Options as a Strategic Investment,” the best-selling work on stock and index options strategies, which has sold over 350,000 copies. An active trader of his own account, he also manages option-oriented accounts for clients. As president of McMillan Analysis Corporation, he edits and does research for the firm’s newsletter publications. optionstrategist.com