


Market shocks can come in a variety of forms. Sometimes the market is wary that a correction might occur. Sometimes it is blissfully unaware of the dangers that lie ahead.
$VIX, or other measures of implied volatility, are typically a reasonable measure of the general market’s attitude prior to a market decline. When traders are wary of a correction, $VIX will be high. For example, at the beginning of 2009, even though the market was up 25% or more from its November lows, $VIX was at 40. Hence, traders were plenty leery of the downside risk in that market—and it did occur, as the market plunged to new lows over the next two months.
At other times, though, $VIX is extremely low prior to a market break. This is less common, but it does occur occasionally. Typically, it would be the first breakdown for the market—a warning sign that there is danger ahead—and then $VIX would elevate going forward. The action in July 2007 illustrates this. $VIX was trading around 15 (very low for those days), and suddenly the market went into a sharp correction as we learned what “subprime debt” was.
After that, even though $SPX rallied to new highs in October 2007, $VIX was much higher as the market reassessed risk. $VIX had been trading in the 13–14 area as late as June 2006, but after the July–August market correction, $VIX traded in a range from 18 to 30 until the market crashed in October 2008, at which time $VIX exploded.
The decline two weeks ago (the week of Oct. 8) was one that came from a period of extremely low volatility. $VIX was below 15 and as low as 11 last month. Even though there were warning signs about a market decline, they did not transfer to a higher $VIX. Then the market broke down sharply, losing 7.8% over six days. Most of the damage came in two days (a loss of 6.4% on Oct. 10 and 11, combined). This action was very similar to what had happened in February 2018, when $SPX collapsed over 7% in a matter of days during a period when $VIX was extremely low (below 13).
This led us to scrutinize some data. We wanted to know just how rare or frequent it is for the market to have a sharp correction from a period of very low $VIX. Specifically, we asked, “How many times has the market corrected 6% or more in less than two weeks when $VIX was below 15 before the correction began?”
It doesn’t happen often—only five times since the creation of $VIX in 1993, as described in the following table.
TABLE 1: MARKET CORRECTIONS OF 6% OR MORE WHEN $VIX BELOW 15
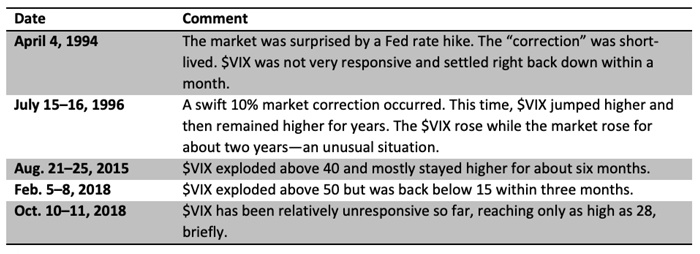
Source: The Option Strategist, www.optionstrategist.com
A look back before the $VIX existed
If we try to include data before the invention of $VIX, we must use the realized volatility of $SPX as our guide to volatility, but that really isn’t the same thing. That is historical volatility, which is backward-looking, while $VIX is implied volatility, which is forward-looking.
Historical volatility can get quite low during bull markets. So, we rather arbitrarily looked for 6% corrections in a two-week time period or less, when 20-day historical volatility was less than 10%, going into the correction. Perhaps a 10% historical volatility is too high; the market is often less volatile (in real terms) than that. In any case, that’s what we used.
This study went back to 1950. In this list of occurrences, the number in brackets indicates how many days the correction was proceeding at a violent level:
- June 1950 (the start of the Korean War) [3]
- May 1951 [1]
- March 1955 [1]
- 1955 [2]
- 1962 (Cuban missile crisis) [2]
- May 1966 [4]
- 1989 (failure of the UAL takeover) [1]
- One other that was not on the list above: May 2010 (the “flash crash”) [2]
So, in total there were 13 such times in 68 years of trading—averaging roughly one every five years or so. The fact that there were two this year is very extraordinary—although not completely unprecedented, as there were also two in 1955 (although, I don’t know what caused them). Some of these were based on news items, but others were not. The latter (no news) are probably more dangerous because selling in the absence of news is more about “real” selling than reflex selling.
Outlook for $VIX
We expect volatility to hold on to some of its recent gains. $VIX came right back down last week when the market rallied, but only to 17 or so—not all the way back to the sub-13 area where it had been. We are expecting that this swift market decline, coupled with the one back in February 2018 (which should still be relatively fresh in people’s memories), will have the effect of keeping $VIX elevated for a while (perhaps in the 17 to 25 range), returning to a more historically normal period for volatility. Of course, things may be different if the Fed raises rates. That’s always been a boost to market volatility as well (and, conversely, keeping rates so low for 10 years has taken a tremendous toll on market volatility).
FIGURE 1: ONE-YEAR CHART OF THE CBOE VIX INDEX
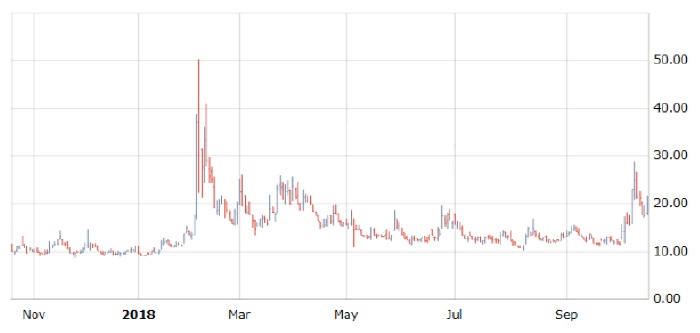
Source: cboe.com, data as of 10.19.18
The opinions expressed in this article are those of the author and do not necessarily represent the views of Proactive Advisor Magazine. These opinions are presented for educational purposes only.
This article is an abbreviated version of market commentary that was first published at optionstrategist.com on Oct. 19, 2018.
 Professional trader Lawrence G. McMillan is perhaps best known as the author of “Options as a Strategic Investment,” the best-selling work on stock and index options strategies, which has sold over 350,000 copies. An active trader of his own account, he also manages option-oriented accounts for clients. As president of McMillan Analysis Corporation, he edits and does research for the firm’s newsletter publications. optionstrategist.com
Recent Posts: