$VIX says August–October is often rough for stocks
$VIX says August–October is often rough for stocks

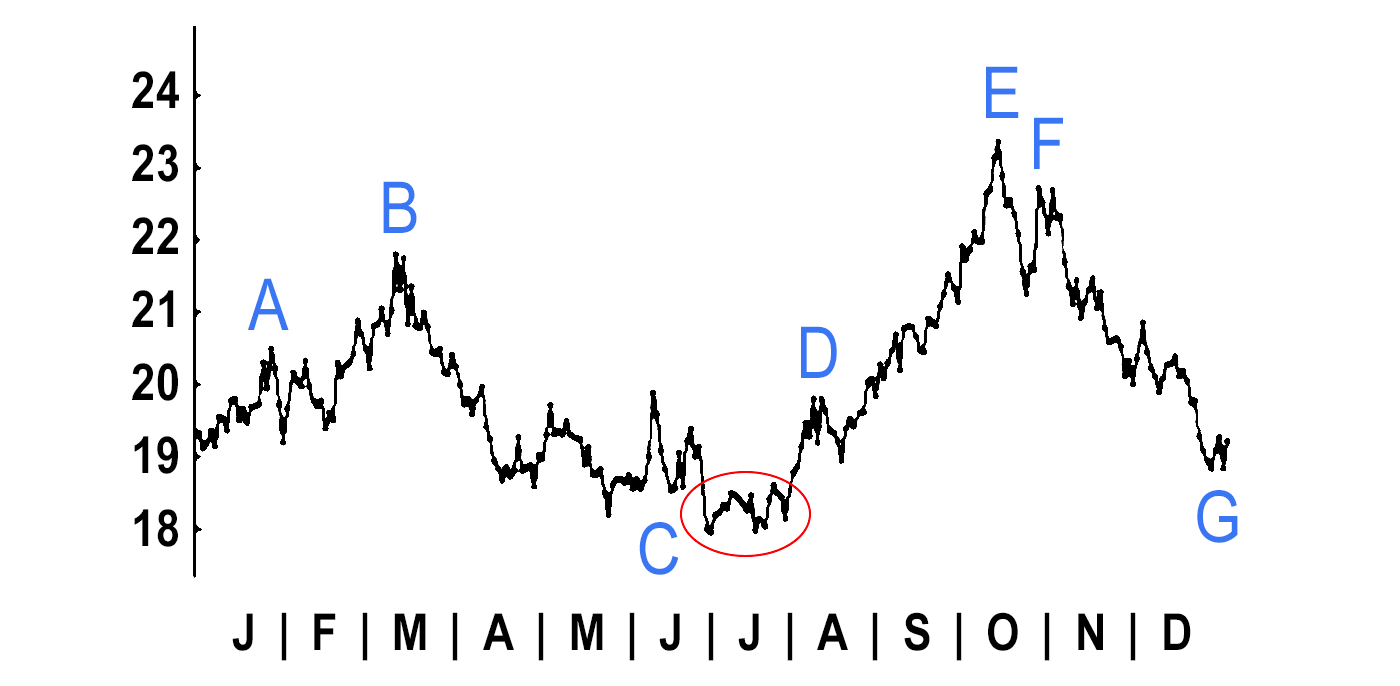
Figure 1 is a chart that we haven’t revisited in a while. It shows the composite value of $VIX (actually, $VXO in the early years) from 1989 through 2022. In reality, the Cboe backdated the original $VIX data to 1986, but including 1987 in the chart just distorts things too much. As it is, the inclusion of the March 2020 $VIX explosion has changed the chart a little.
FIGURE 1: HISTORICAL VIX COMPOSITE BY TRADING DAY OF THE YEAR
34-year composite: 1989–2022

Source: McMillan Analysis Corporation
$VIX typically starts the year at a low point and rises through most of January, to point “A” in Figure 1. Then there is a lull until another $VIX rally in March (point “B”). Before 2022, that March rally was subdued. But it was monstrous in 2020, so point “B” is higher than it used to be.
From there, $VIX declines into its summer lows. For years, the composite low of $VIX was right on the Fourth of July holiday. Now, it’s spread throughout July. So, point “C” is really that entire circle surrounding the low area of the annual chart.
Then, contrary to what most people think, August is a volatile month. That August volatility intercedes, causing $VIX to rise sharply to point “D,” which is really just a warning shot across the bow that volatility is going to increase sharply during September and into October. The annual $VIX chart peaks at points “E” and “F” in October. This part of the pattern was strongly evident in 2022, but only modestly so in 2021.
Typically, at that point, traders are geared up for more volatility, but it doesn’t happen. Instead, $VIX declines sharply during the last quarter of the year, ending the year at point “G,” which is almost equal to the annual lows.
Of course, not every year complies with this chart exactly, but many have this general shape. That is why we occasionally return to this chart—to remind ourselves, and you, of what to expect from $VIX.
Correspondingly, $SPX moves in the opposite direction from $VIX, so August–October is often rough for stocks.
Interestingly, the week after September options expiration (i.e., the week after the third Friday of September) is historically a very negative week for the market. In fact, last year, that week saw a 180-point decline in $SPX, the largest point decline that we have seen in the 33 years that we have been using this indicator. It was not the largest percentage drop in a week for this system (that occurred in 2011).
On average over those 33 years, $SPX has dropped by 1% over the week in question. For most of the past three years, a 1% move in a week has not been unusual, although it was before that. In any case, in those 33 years, $SPX has dropped 26 times and risen seven times in the week. Other studies show that this seasonally negative pattern often extends into October.
The opinions expressed in this article are those of the author and the sources cited and do not necessarily represent the views of Proactive Advisor Magazine. This material is presented for educational purposes only.
This is an edited version of commentary that was first published at optionstrategist.com on Sept. 15, 2023, and May 12, 2023.
 Professional trader Lawrence G. McMillan is perhaps best known as the author of “Options as a Strategic Investment,” the best-selling work on stock and index options strategies, which has sold over 350,000 copies. An active trader of his own account, he also manages option-oriented accounts for clients. As president of McMillan Analysis Corporation, he edits and does research for the firm’s newsletter publications. optionstrategist.com
RECENT POSTS


