For much of the past year, market discussion has centered on interest rates, mega-cap technology stocks, artificial intelligence, and the timing of the Federal Reserve’s policy decisions. Since last February, the war in Iran and its impact on global economies, supply chains, inflation, and energy prices have taken center stage.
Those remain important themes, but recent reports point to another economic story worth watching: signs of improvement in U.S. manufacturing.
ISM Manufacturing PMI report
The Institute for Supply Management’s latest Manufacturing PMI report provided an encouraging snapshot of manufacturing activity:
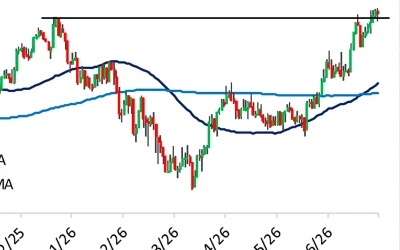
FIGURE 1: ISM MANUFACTURING PMI—2024–2026 TREND

Source: Institute for Supply Management
Several components of the ISM report also moved higher. New orders expanded for the fifth straight month, and production increased for the seventh straight month. The backlog of orders index also rose above 50, suggesting that some manufacturers are seeing order activity build. Customer inventories remained low, which ISM generally views as positive for future production activity.
S&P Global U.S. Manufacturing PMI
S&P Global reported that its U.S. Manufacturing PMI rose to 55.1 in May from 54.5 in April, also the strongest reading since May 2022. The report noted stronger production growth, continued gains in new orders, and ongoing pressure from supply-chain disruptions and rising input costs:
“A sharp and stronger improvement in US manufacturing conditions was signaled by May’s S&P Global PMI data amid the sharpest upturn in production since April 2022.
“New orders increased markedly again, but growth in both output and sales was in part driven by stock building as firms sought to protect themselves from supply chain disruption and steeply rising prices caused principally by the war in the Middle East, which remained a notable headwind for the sector.
“Indeed, manufacturing input costs rose at a rate unmatched in nearly four years, whilst supplier delivery times deteriorated to the greatest extent since August 2022. Confidence in the outlook also softened since April, though remained sufficiently positive to help explain a further rise in employment.”
FIGURE 2: S&P GLOBAL U.S. MANUFACTURING PMI—10-YEAR VIEW
Index, SA, >50 = Improvement M/M

Source: S&P Global PMI
Government data improves
The improvement has not been limited to the major survey-based indicators. The Federal Reserve reported that industrial production rose 0.7% in April, after decreasing 0.3% in March:
The Census Bureau’s May 28 report showed a sharp increase in durable goods orders, led by transportation equipment:
FIGURE 3: DURABLE GOODS NEW ORDERS 2025–2026
Seasonally adjusted, month-to-month percentage change

Source: U.S. Census Bureau
![]() Related Article: Beyond the headlines: The ‘Magnificent Seven,’ AI, and the technology product cycle
Related Article: Beyond the headlines: The ‘Magnificent Seven,’ AI, and the technology product cycle
Manufacturing gains are a welcome change in trend
These data points hardly mean that manufacturing is now leading the entire economy. The U.S. remains a service-heavy economy, and manufacturing employment has been more restrained than output. In May, the ISM employment index remained below 50, indicating that manufacturers were still cautious about adding workers. But the sector can produce more without a comparable increase in employment, especially as automation, technology, and productivity play larger roles.
The improvement also follows a difficult period for manufacturing. Higher borrowing costs, inventory adjustments, uneven global demand, and changing supply-chain patterns have all affected the sector over the past several years. Against that backdrop, the latest data is notable because it shows broader activity improving from a weaker base.
The recent data points to expansion, improving orders, and higher production. Whether that continues will depend on demand, financing conditions, inventories, and corporate investment plans. For now, manufacturing has moved from being a weak spot in the economy to an area showing measurable improvement.
What would it cost to reduce dependence on imports?
Barron’s offered a broader perspective on U.S. manufacturing by highlighting the scale of investment, labor, and infrastructure needed to reduce dependence on critical imports:
“Revitalizing U.S. manufacturing and bringing home critical supply chains is a priority for the Trump administration. But the U.S. needs at least $2 trillion for such a task, and that’s just the start, according to a new report from McKinsey Global Institute.
“The U.S. has taken steps to improve its access to critical goods and to increase production of them at home. The report, however, highlights the vast amount of not only capital, but also skilled workers and infrastructure still needed to reduce U.S. dependence on imports for such products. In other words, it’s no quick fix.
“The U.S.-China rivalry and the Iran war illustrate how relying on one area for a large share of critical goods can create pain points for the economy. For the U.S., Beijing’s ability to leverage its rare-earth-magnet dominance in trade negotiations was the latest wake-up call, as those inputs are used in everything from weapons systems to electric-vehicle motors.
“America’s dependence on China for these critical goods offered a glimpse into a bigger problem. The U.S. imports about $3 trillion of manufactured goods each year, and McKinsey classifies about a quarter, or about $750 billion, of those as the country’s ‘Achilles’ heel.’ …
“To deal with those products, McKinsey estimates that U.S. manufacturing would need to double on average to fully meet domestic demand, and $2 trillion—roughly 6% of the size of the overall economy— would be needed to transform the industrial base.”
FIGURE 4: THE STATE OF U.S. MANUFACTURING IN THREE CHARTS

Sources: S&P Global Comparative Industry Service, U.S. Bureau of Economic Analysis, U.S. International Trade Commission, U.S. Bureau of Labor Statistics, McKinsey Global Institute analysis
RECENT POSTS