


A successful strategy is to “buy the dip” in rising bull markets. The “dip” provides investors a profitable entry point for new money. This year has included prime examples. Buying the dips in February or March produced double-digit gains. The S&P 500 is up 10%, and the NASDAQ is up twice that, with a 20% gain (measured from either 2/8/18 or 4/2/18 through 7/25/18).
When we hear the expression “buy the dip,” it usually refers to a dip in prices. But there is another type of “dip.” It also occurs in bull market runs. It is rare, and like buying the price dips, it has a great track record of being very profitable. I’m referring to the dip that occurs in the price-earnings ratio (P/E ratio).
A typical chart of the trend in the P/E ratio in a bull market is a “steady Eddie,” an orderly, glacial move higher. The P/E ratio usually moves from a depressed level (reflecting investors’ pessimistic outlook) at the end of the last bear market. When a new bull market takes hold, the P/E ratio gradually climbs higher as investor optimism is restored. The P/E ratio eventually peaks at the height of optimism, signaling the end of the bull run.
FIGURE 1: PERCENTAGE GAIN IN P/E RATIO IN BULL MARKETS
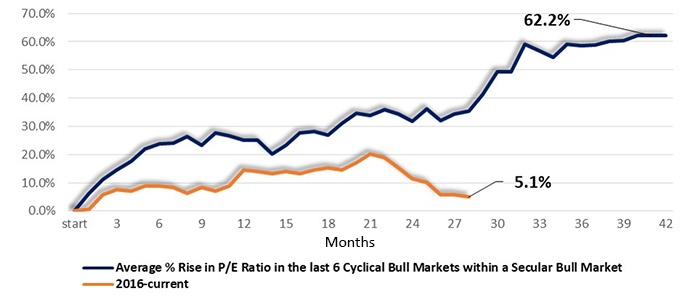
Source: STIR Research
Within the past six cyclical bull markets in a secular bull environment, the weakest gain in the P/E ratio was just a 25% expansion from 9.7 to 12.1 in the short bull market from 12/1987–7/1990. The biggest gain was a double in the P/E ratio from 10.3 to 20.7 in the eight-year bull run from 10/1990–7/1998. The median gain in the P/E ratio has been 60% over the life of a cyclical bull market in a secular bull.
Dips in the P/E ratio are uncommon. The primary cause for a P/E dip is when earnings are rising faster than prices. While price dips in a bull market are common, a dip in the P/E typically occurs just once. The last three-and-a-half-year cyclical bull market run, 10/2011–5/2015, had six price dips of over 5%, giving investors six opportunities to buy the dip. Investors were given just one opportunity to buy the dip in the P/E ratio. But that dip was rewarding, leading to double-digit gains.
The S&P one-year forward P/E ratio was at 15.8 at the start of the current cyclical bull market that began in February 2016 (see Editor’s note at end of article). It hit a high of 19.0 in November 2017 and fell back to 16.6 at the end of June 2018. The P/E ratio trend for the current bull market has been slightly trailing the average over the past several decades in percentage gains. However, the current dip in the P/E ratio of 12.4% from its November peak is matching the median dip seen since 1982 (Table 1).
TABLE 1: S&P 500 GAINS AFTER DIPS IN P/E RATIO
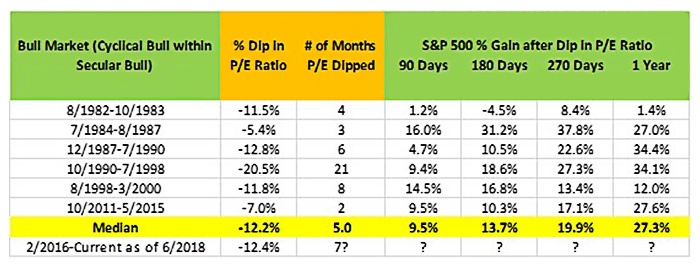
Source: STIR Research
The market has recently experienced one of its rare dips in the P/E ratio. This gave investors a chance to buy the dip. In looking at the past six bull markets in a secular bull run, investors are offered just one opportunity to catch a P/E dip in each bull market. We know buying S&P 500 price dips can be rewarding, and so can buying those rate dips in the P/E ratio.
If the market rally following the current dip in the P/E ratio delivers just an average gain, the S&P 500 should be approaching 3,100 by year-end (a 13.7% gain over the next 180 days counting from the end of June) and closing in on 3,500 by the summer of 2019, for a 27% one-year gain!
Editor’s note: Statistical summary compiled by STIR Research using data from NDR covering defined cyclical bull markets and the S&P 500 one-year forward P/E ratio. Please note that based on this data, Mr. Schield is drawing a distinction between cyclical and secular bull markets. The current cyclical bull market, according to this data, began in February 2016.
The opinions expressed in this article are those of the author and do not necessarily represent the views of Proactive Advisor Magazine. These opinions are presented for educational purposes only.
 Marshall Schield is the chief strategist for STIR Research LLC, a publisher of active allocation indexes and asset class/sector research for financial advisors and institutional investors. Mr. Schield has been an active strategist for four decades and his accomplishments have achieved national recognition from a variety of sources, including Barron's and Lipper Analytical Services. stirresearch.com
Recent Posts: