


It appears for the third year in a row that Wall Street strategists’ predictions for market gains for the coming year will be too low. Our 2018 outlook provides supporting rationale for this point of view.
In 2016, the consensus by strategists was for gains in the mid-single digits. Our (STIR Research) outlook was to expect double-digit gains with a goal of 2,500. That is what the market delivered.
In 2017, the consensus of Barron’s survey of 10 Wall Street analyst forecasts was for gains of just over 6%. We called for a move of 20% higher on the S&P 500 to a level around 2,700. The market again delivered with a 19.4% gain.
For 2018, the mean S&P 500 forecast by Barron’s 10 major firm strategies is for a 5% rally to around the 2,840 level. Our 2018 outlook indicates that is too low and that the market will again outperform expectations.
FIGURE 1: STIR RESEARCH’S 2018 OUTLOOK—PROJECTED PATH FOR S&P 500

2018 outlook: Four reasons this bull market should move higher
1. Global growth is accelerating. The U.S. has been leading other developed countries in GDP growth for the past eight years. Since the expansion that began in Q3 2009, growth has averaged just 2.1%, the slowest since World War II. In 2017, U.S. growth has consistently moved higher in each successive quarter, with expectations of reaching 2.7% for the full year and accelerating to 3.1% in 2018. Globally growth is also accelerating, moving from 3.0% in 2016 to 3.4% in 2017 and to 3.8% in 2018. Emerging Markets are the largest contributor to that growth rate.
2. It is a global bull market (finally). The U.S. has been in a secular bull market for over six years, while Developed Countries and Emerging Markets have been stuck in a decadelong secular bear market. That ended in 2017 when all of the global markets began to enjoy secular bull market runs. The last time global markets enjoyed simultaneously strong economic growth and bull markets was back in 2002–2007. At that time U.S. markets rose over 100%, Developed Countries gained 206%, and Emerging Markets rose more than 400%.
3. Record earnings. S&P 500 earnings are expected to finish 2017 at a record high of $131.45 earnings per share (EPS). That would represent a 20% increase for the year. For 2018, earnings are expected to rise to $147.00 based on accelerating global and domestic growth. But now, reasonable expectations are to add in another $10 to $14 a share from a lower tax bill for corporations—earnings growth then would jump to over 20%. As the old Wall Street adage goes, “Earnings are the mother’s milk of stocks.”
4. Stocks are undervalued. While it is popular to proclaim stocks are overvalued, those comments are based on the use of one yardstick—high price-earnings (P/E) ratios. There are many other yardsticks that point in the opposite direction, the fact that stocks are actually undervalued.
One such measure is the earnings yield on stocks versus the interest rate on bonds. This is one of the favorite evaluation tools of the Federal Reserve. Currently, the earnings yield (earnings/stock price) is close to 5.0% versus 2.5% for the 10-year Treasury bond. Using the “Fed model” for stock valuation, stocks are undervalued by almost 50%—meaning the S&P should theoretically be trading over 5,000 instead of at 2,700–2,800.
Many argue that stocks have gained more than 33% in just the last two years and therefore cannot be undervalued. Yes, they can. Corporate profits have also risen by 33%, which means P/E ratios have essentially not moved higher during the past 24 months. Additionally, the earnings ratio on stocks versus yields on bonds has also remained unchanged. Stocks have been moving in lockstep with earnings gains and probably will continue to do so, with the market likely to outperform expectations.
Historical data supports another year of double-digit gains
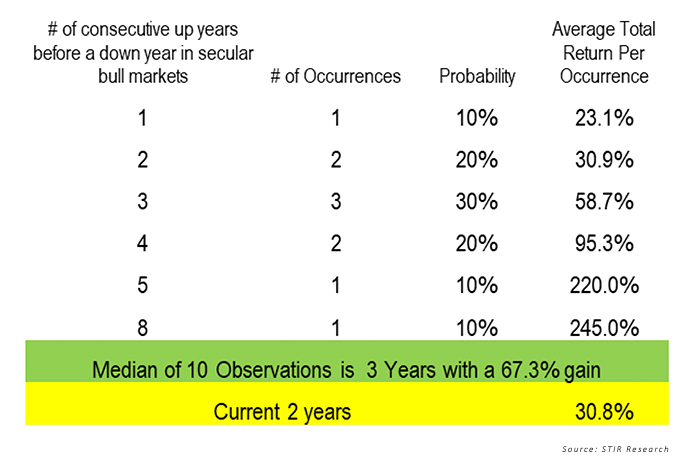
There is a 70% probability that this bull market has at least one more year of gains. Looking at just secular bull markets (1949–1968, 1982–2000, 2011–2017), history shows that the market will have multiple back-to-back up years before being interrupted by a negative year.
Rarely does the market advance just one or two years before hitting a down year. That sequence has only occurred three times, or 30% of the time. The market now has just finished its second up year with cumulative gains of more than 30%. History tells us that the market has a 70% probability of going three or more years with higher returns. The average gain if the market makes it to three consecutive up years is 58.7%. That would fit STIR’s 2018 outlook for another 20% gain this year, which would translate into a cumulative three-year gain of 57%.
FIGURE 2: DISTRIBUTION OF CONSECUTIVE YEARS OF GAINS IN BULL MARKETS
The opinions expressed in this article are those of the author and do not necessarily represent the views of Proactive Advisor Magazine. These opinions are presented for educational purposes only.
 Marshall Schield is the chief strategist for STIR Research LLC, a publisher of active allocation indexes and asset class/sector research for financial advisors and institutional investors. Mr. Schield has been an active strategist for four decades and his accomplishments have achieved national recognition from a variety of sources, including Barron's and Lipper Analytical Services. stirresearch.com