


I like to keep my market analysis simple. In fact, other than the occasional moving average, I don’t use any indicators whatsoever. Indicators don’t indicate. They simply help to illustrate what’s already in the chart.
Also, since indicators are price-based, (i.e., a second derivative), there will be lag. With that said, I have found that by combining price with a moving average some of the lag is eliminated. Further, this can help to keep you on the right side of the market. Let’s explore this further using the concept of moving-average “daylight.”
Source: davelandry.com
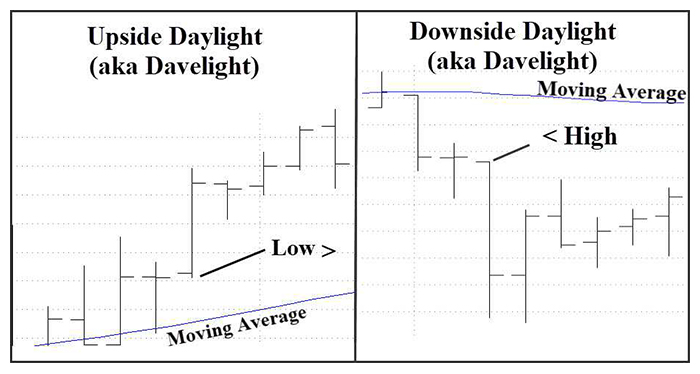
As mentioned in a previous article for Proactive Advisor Magazine, moving-average daylight (which one client has dubbed “DaveLight”) is simply when the lows are above the moving average for uptrends and the highs are below the moving average in downtrends. Again, like all indicators, there can be lag, but by adding in the price component, some of the lag is eliminated.
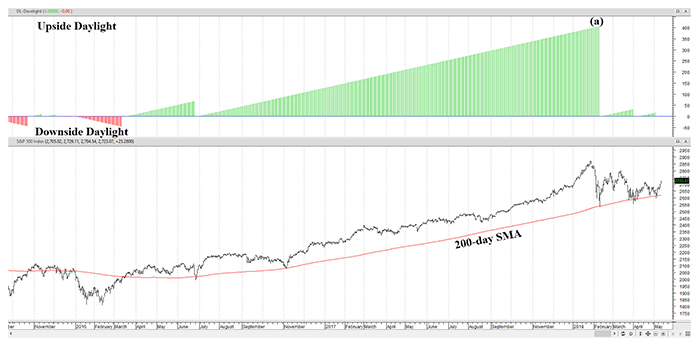
In Figure 2, I have added the closely watched 200-day simple moving average (SMA) along with a daylight indicator to the S&P 500. The indicator simply counts days of daylight, not magnitude.
For instance, a reading of +100 (green) would mean that the market has had upside daylight (lows > 200 SMA) for 100 days. As soon as the market touches the moving average, the days of daylight resets back to zero (no daylight) and the count starts over.
Notice that there was upside daylight for a long time during the 2016-2018 period. At its peak (a), the market went over 400 trading days without touching its 200-day moving average.
Source: davelandry.com. Charts and indicators provided by MetaStock.
Daylight can also be very useful in longer-term analysis. It can really help you see the forest for the trees.
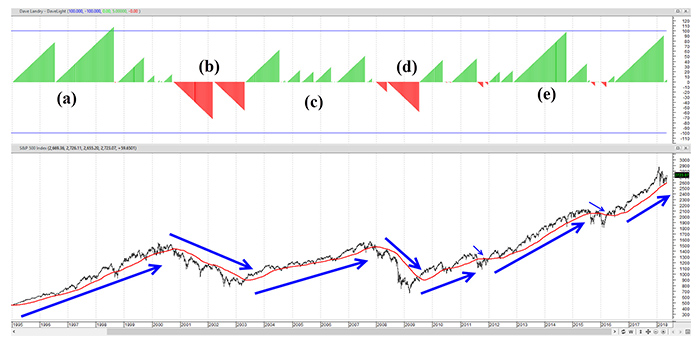
In Figure 3, I have plotted the weekly S&P 500 with a 50-week simple moving average. Notice in the great bull run of the mid to late 90s (a) there was virtually no downside daylight (red). Fast-forward to the bear market of 2000 (b) and there wasn’t any upside daylight (i.e., no green) until the bull market that began in 2003. During the entire run (c), until the peak in 2007, there was virtually no downside daylight (just one week). Downside daylight began in early 2008 and stayed completely “red” (d) until 2009. Since then, we have been mostly “green” (e), with a few corrections in between.
Source: davelandry.com. Charts and indicators provided by MetaStock.
As a trend follower, I don’t try to anticipate when the trend will end. However, I have observed that when the daylight count reaches an extreme reading (e.g., around +100 using a weekly 50-day SMA or +300–400 on a daily chart with a 200-day moving average), a correction often follows. When extreme readings occur, I don’t exit my long positions. I do become prudent in my profit-taking and honoring my stops just in case. I also become very selective on new positions.
Corrective action sometimes is just that, and sometimes it’s the start of something much bigger. The great thing is that you can’t have a bear market without weekly downside daylight. Of course, with anything trend following you may be a little late to the game, but for the most part, a simple technique like this will help keep you on the right side of the market.
Could moving-average daylight analysis be the magical “red light” or “green light” that will keep you on the right side of the market? No, but as you can see above it can be quite useful. Stay in the light, the light is good!
(P.S. Feel free to contact me directly at davelandry.com with any questions.)
The opinions expressed in this article are those of the author and do not necessarily represent the views of Proactive Advisor Magazine. These opinions are presented for educational purposes only.
This article first published in Proactive Advisor Magazine on May 17, 2018, Volume 18, Issue 6. Some content has been updated.
 Dave Landry has been trading the markets since the early 1990s and is the author of three books on trading. He founded Sentive Trading LLC in 1995 and since then has been providing ongoing consulting and education on market technicals. He is a member of the American Association of Professional Technical Analysts and was a registered Commodity Trading Advisor (CTA) from 1995 to 2009. davelandry.com