


In order to follow a trend, you must first have a trend to follow. Therefore, as a trend follower, you will frequently be a little late to the party. And, although you will often overstay your welcome a bit, you can still usually get out with plenty of time to avoid a nasty hangover. We’ll leave the top and bottom picking to the gurus and catch as much of the middle as possible. The great news is that simple trend-following techniques can help us accomplish this goal.
To recap from the previous article: There’s nothing magical about moving averages, but they can help keep you on the right side of the market. Since all price-based indicators have lag, I like to look for patterns in price itself. With moving averages, I like to look for price “daylight” (which a client has jokingly redubbed “Davelight”). This means that the price bar lows are greater than the moving average in uptrends. Conversely, price bar highs are less than the moving average in downtrends. There is “light” between the price bars and the moving average. This is illustrated in Figure 1.
FIGURE 1: PRICE BAR TRENDS VS. MOVING AVERAGES
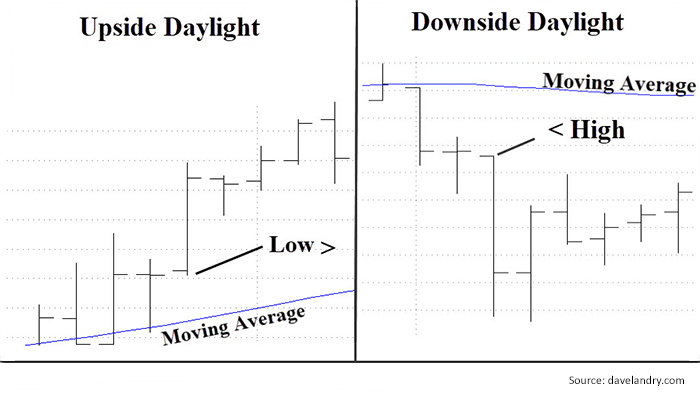
Combining price action with the moving average helps to eliminate some of the lag. Now, you certainly don’t want to rush out and buy and sell every time the market crosses the moving average. But paying attention to daylight—especially over multiple consecutive periods—can help keep you on the right side of the market.
Let’s take a look at this concept using the weekly S&P 500 and a 50-day simple moving average. In Figure 2, upside “daylight” is illustrated in green, and downside “daylight” is illustrated in red.
FIGURE 2: S&P 500 PRICE TREND (1995–2017)
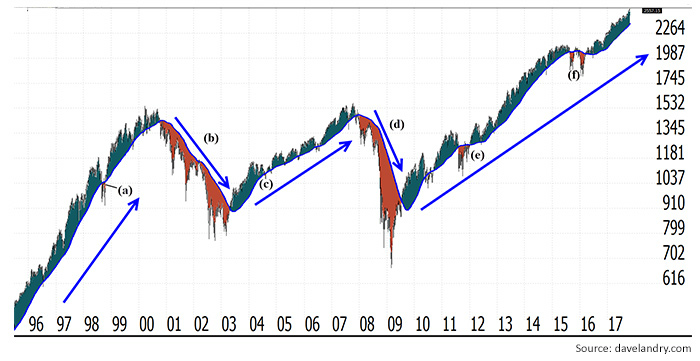
Notice that there was virtually no downside daylight during the great bull run of the 1990s (a). What’s amazing is that, in the subsequent bear market, there was no upside daylight from October 2000 until May 2003 (b). And, there was only one bar of downside daylight during the bull market that began in 2003 (c). Fast forward to the 2008 bear market (d), and there was no upside daylight until October 2009. (Obviously, here the signal had some lag due to the sharp V-shaped recovery of the market.) Nevertheless, the subsequent bull market that we’re still in remains quite impressive! Since 2009, there has been very little downside daylight (e and f).
Technical analysis has the word “technical” in it, but it doesn’t have to be that technical. Something as simple as moving-average daylight can do a great job of keeping you on the right side of the market.
The opinions expressed in this article are those of the author and do not necessarily represent the views of Proactive Advisor Magazine. These opinions are presented for educational purposes only.
 Dave Landry has been trading the markets since the early 1990s and is the author of three books on trading. He founded Sentive Trading LLC in 1995 and since then has been providing ongoing consulting and education on market technicals. He is a member of the American Association of Professional Technical Analysts and was a registered Commodity Trading Advisor (CTA) from 1995 to 2009. davelandry.com