


In order to follow a trend, you must first have a market trend to follow. Therefore, with trend following, you’re going to be a little late to the party. You’re also going to overstay your welcome. In the end, what appears to be a normal and healthy correction turns into something much bigger. It’s OK to be a little late jumping on board a market trend, and it’s OK if you give up some of that trend in the end. It comes with the territory.
It is important that you get on the new market trend as soon as possible and obviously recognize when an old trend may be coming to an end. The good news is that simple concepts such as “bowties,” “daylight,” and simply price itself can alert you that the market trend may be turning.
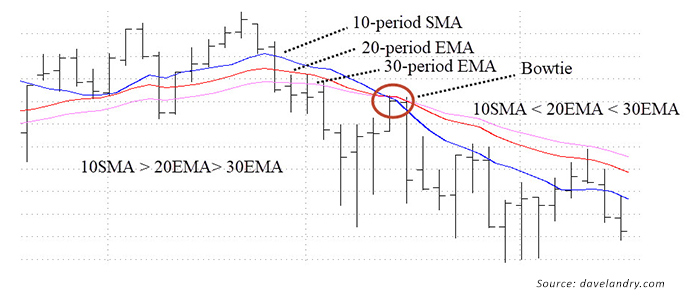
The “bowtie” is a crossing of the 10-day simple moving average (sma), 20-day exponential moving average (ema), and the 30-day exponential moving averages over a short period of time, giving the appearance of a bowtie. For an emerging downtrend, this would mean the 10sma > 20ema > 30ema crossing quickly (ideally) over to 10sma < 20ema < 30ema. This is illustrated in Figure 1. The crossing signals that the old trend may be ending and a new one may be emerging. The trigger would be a resumption of the new trend after a one-bar pullback. (See davelandry.com for a more detailed explanation.)
FIGURE 1: EXAMPLE OF THE BOWTIE PATTERN
Bowties are great, but like all indicators, they will have some lag. Therefore, I first like to look for patterns in price itself.
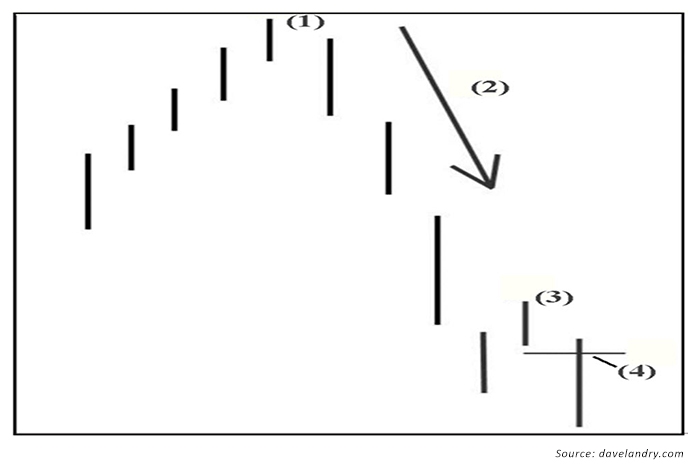
Sometimes a market will make a sharp transition in market trend versus a more gradual rollover. When this occurs, the moving averages can be slow to catch up. Therefore, I like to look for a pattern that I have dubbed a “first thrust.” The first thrust is simply a market that makes a sharp thrust lower (relative to its volatility) followed by at least a one-bar pullback. An entry would then be triggered when the low of the pullback bar is taken out. This is illustrated in Figure 2.
FIGURE 2: EXAMPLE OF THE FIRST-THRUST PATTERN
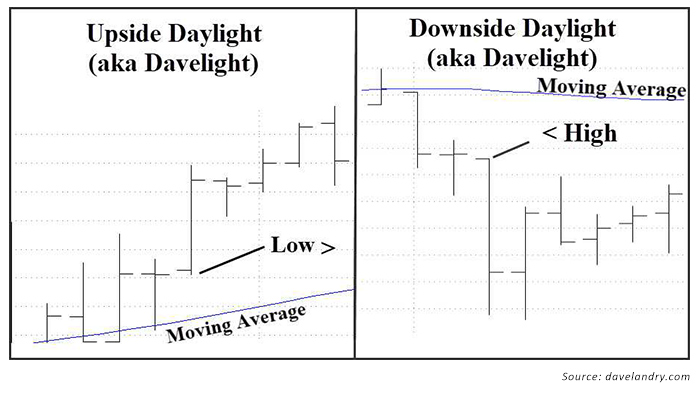
“Daylight” (which a client has recently renamed “Davelight”) combines price and the moving average. This helps to eliminate some of the lag associated with moving averages in and of themselves. The concept of “daylight” simply means that the price bar lows are greater than the moving average in uptrends. Conversely, highs of the bars are less than the moving averages in downtrends. There is “light” between the price bars and the moving average. This is illustrated in Figure 3.
FIGURE 3: EXAMPLE OF DAYLIGHT PATTERNS
With the market beginning to tank (this article was written on 2/8/18), now’s the time to pay careful attention to a potential market-trend turn.
I suppose the $64,000 question is “What constitutes a market-trend turn?” Well, it depends on your time frame. A market will turn on an hourly chart before it turns in the daily chart and will turn on a daily chart before it turns on a weekly chart, and so forth. So, where are we now?
I define a “major” sell signal as one that comes off multi-year highs, ideally all-time highs. On the flipside, major buys occur after multi-year lows, ideally all-time lows. A “minor” signal would occur at anything in between.
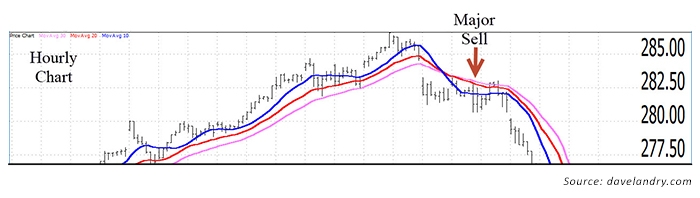
Let’s start with an hourly chart and work our way up. The hourly S&P (I use the SPY for intraday charts) signaled a major sell signal on 1/31/18 by forming an hourly bowtie just after all-time highs (Figure 4).
FIGURE 4: EXAMPLE OF MAJOR SELL SIGNAL USING BOWTIE PATTERN (SPY)
When we back out to the daily chart, we see that a first thrust down triggered on 2/8/18 (Figure 5).
FIGURE 5: EXAMPLE OF FIRST-THRUST DOWN SELL TRIGGER (SPX)
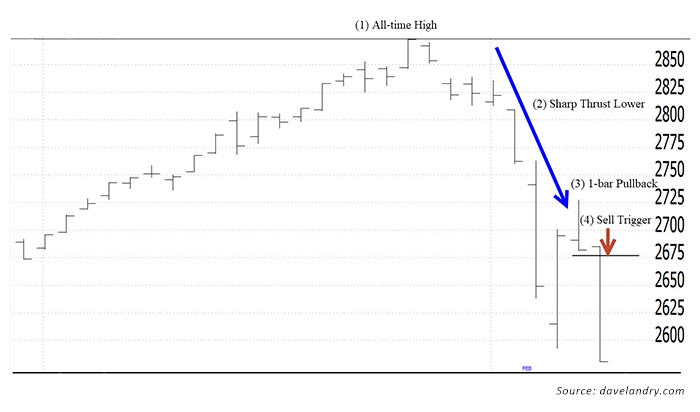
Notice in Figure 5 that after making all-time highs on 1/26/18, the S&P has a sharp thrust lower (2). Then on 2/07/18, it pulls back (3). The setup triggers on 2/08/18 (4) when the stock takes out the low of (3).
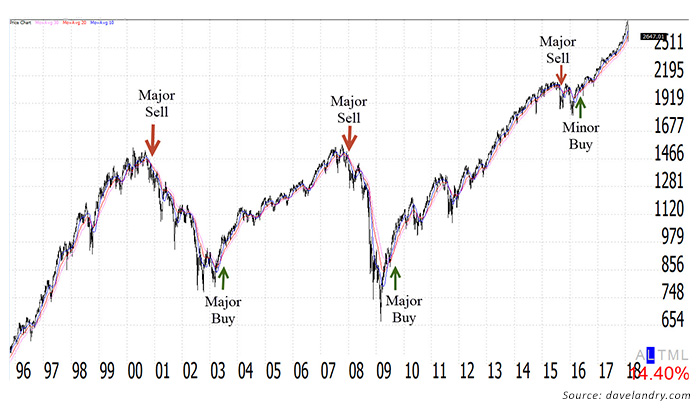
When we back out to the weekly chart, we see that most of the major bull and bear cycles over the past two decades followed major bowtie signals. A “major” bowtie is defined as a signal that comes off of multi-year highs (Figure 6). Obviously, we won’t see a major weekly sell signal until and unless the daily forms a bowtie sell signal first.
FIGURE 6: EXAMPLES OF MAJOR BUY AND SELL SIGNALS (SPX)
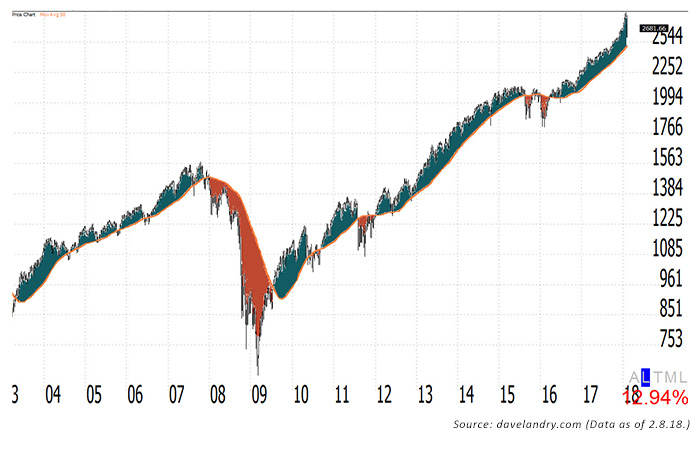
“Daylight” can also be useful to keep you on the right side of the market trend. Notice that in Figure 7 I have plotted a weekly S&P with a 50-week simple moving average. The green areas indicate times where there was upside daylight (lows > MA), and the red areas indicate times when there was downside daylight (highs < MA). This simple indicator in and of itself can help to keep you in major bull cycles and short (or out!) of major bear cycles.
Based on current prices, the weekly S&P would have to drop below 2,500 (and it is very close as of this writing!) before we would have downside daylight.
FIGURE 7: ILLUSTRATION OF “DAYLIGHT” IN CURRENT MARKET (SPX)
So where are we now?
As you can see from the analysis presented here, we had sell signals on both the hourly and daily charts. Volatility has increased significantly, markets are moving fast, and now is the time to be prudent. Shorter term, the trend appears to be turning down. Therefore, make sure that you really like setups on the long side, taking those that you believe can trend higher despite a weakening market (possibly selected commodities). Keep an eye out for weekly signals because they can often suggest the beginning of the end of a market trend.
The opinions expressed in this article are those of the author and do not necessarily represent the views of Proactive Advisor Magazine. These opinions are presented for educational purposes only.
 Dave Landry has been trading the markets since the early 1990s and is the author of three books on trading. He founded Sentive Trading LLC in 1995 and since then has been providing ongoing consulting and education on market technicals. He is a member of the American Association of Professional Technical Analysts and was a registered Commodity Trading Advisor (CTA) from 1995 to 2009. davelandry.com