
This October, U.S. stocks have taken a real beating. After hitting all-time highs in late September, U.S. markets are beginning to look like the rest of the global markets, many of which are either in corrections or in true bear markets. In looking at 50 country and region-specific ETFs, their performance picture versus the U.S. is like night and day.
- Over 30 were in correction territory (down more than 10% but less than 20%), including Canada, Mexico, France, Japan, and Switzerland.
- Another 20 were in full-fledged bear market mode (off more than 20%). Several were emerging markets (China, Chile, Singapore, and India), but many were developed countries (Germany, South Korea, Spain, and Italy).
One Wall Street adage is “when the U.S. sneezes, the rest of the world catches a cold.” But today we are seeing just the opposite. The rest of the world has a cold and the question becomes, “Is the U.S. immune to significant downside—or are we coming down with the world’s bear market cold?”
Three factors support the conclusion that the U.S. market is just coming down with a case of the sniffles:
- Nine-month seasonality, moving from worst to best. The weakest three-quarter span for the market within the 16 quarters in the presidential cycle is Q1 through Q3 in a midterm election year. Since 1971, the NASDAQ has fallen on average 5.2% over those nine months. Shift the calendar by three weeks for 2018, and run the nine-month period from Jan. 26 to Oct. 24, and the NASDAQ has lived up to its reputation by falling 5.3%. The market’s sweet spot of the four-year presidential cycle starts in Q4 of the midterm election year and runs through the first half of the pre-election year. For that nine-month period, the NASDAQ has gained 32.8% and the S&P has delivered double-digit returns averaging 21.1%.
- October is the bear killer. October holds the reputation for being both a jinx month with big market crashes (like in 1987 and many years) and, at other times, a “bear killer.” This is where market direction has flipped from bear to bull. There are 12 cases since 1946, with 2001, 2002, and 2011 being recent examples.
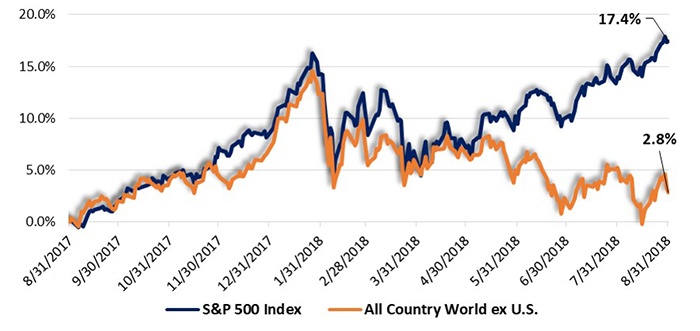
- Is the U.S. overperformance really a signal for a rally—perhaps as much as 16%? More than 3% gains in GDP growth, along with earnings gains of 25% on a year-over-year basis for Q1, Q2, and now Q3, have made the U.S. markets the best place in the world to be invested. The S&P 500 outperformed the rest of the world by more than 14 percentage points for the 12 months ending August 31.
FIGURE 1: 12-MONTH RELATIVE PERFORMANCE—SPX VS. GLOBAL MARKETS (8/2017–8/2018)

Sources: FastTrack database, STIR Research
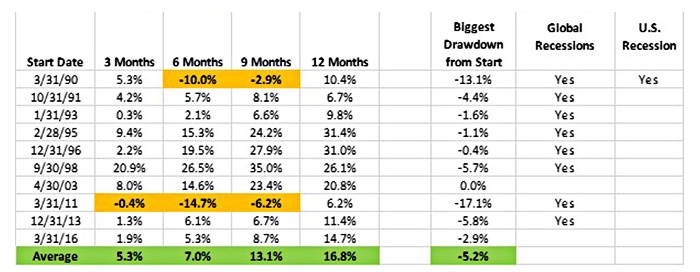
History shows that when the U.S. market outperforms the rest of the global markets by more than 10 percentage points on a year-over-year basis, it is a very bullish sign for the future. (The 1,000-basis-point threshold was reached on August 31, 2018, and again at the end of September 2018.)
TABLE 1: S&P 500 PERFORMANCE AFTER 12-MONTH OUTPERFORMANCE
OF ACWI EX-U.S. INDEX
By more than 10 percentage points year over year

Sources: FastTrack database, STIR Research, OECD, National Bureau of Economic Research
- The batting average is 90% for a three-month gain of more than 5%, and there is an 80% batting average in the six- and nine-month periods for gains of 7% and 13%, respectively.
- But it isn’t an all-clear sign. In two cases, the S&P 500 fell double digits from the start date before rallying. Also, in two cases, they included domestic bear markets (a 1990 drawdown of 19.9% and a 2011 drawdown of 19.4%).
- However, there is a 100% batting average of a higher market in a year, favoring a double-digit gain!
With continued strong corporate earnings gains of 20% or more, and reasonable valuations combined with strong seasonal trends, probabilities favor the current correction to be nothing more than that in an ongoing cyclical bull market—with a double-digit potential upside.
The opinions expressed in this article are those of the author and do not necessarily represent the views of Proactive Advisor Magazine. These opinions are presented for educational purposes only.
 Marshall Schield is the chief strategist for STIR Research LLC, a publisher of active allocation indexes and asset class/sector research for financial advisors and institutional investors. Mr. Schield has been an active strategist for four decades and his accomplishments have achieved national recognition from a variety of sources, including Barron's and Lipper Analytical Services. stirresearch.com
Recent Posts:
