


I sounded alarm bells in my April 2020 article that warned of a potential crash in WTI crude oil.
That forecast, three weeks before the March 2020 sell-off went even further, highlighted $45 and $42.45 as key price levels where support should have been found. Once the support was broken, the market gapped lower, forming a gap between $40.80 and $36.35 and, later, some weak support at $19.46. Once that level was broken, WTI was doomed to dive to $10 and below. There was little technical support to rely on at that point, and WTI took a free fall into negative territory.
I wrote,
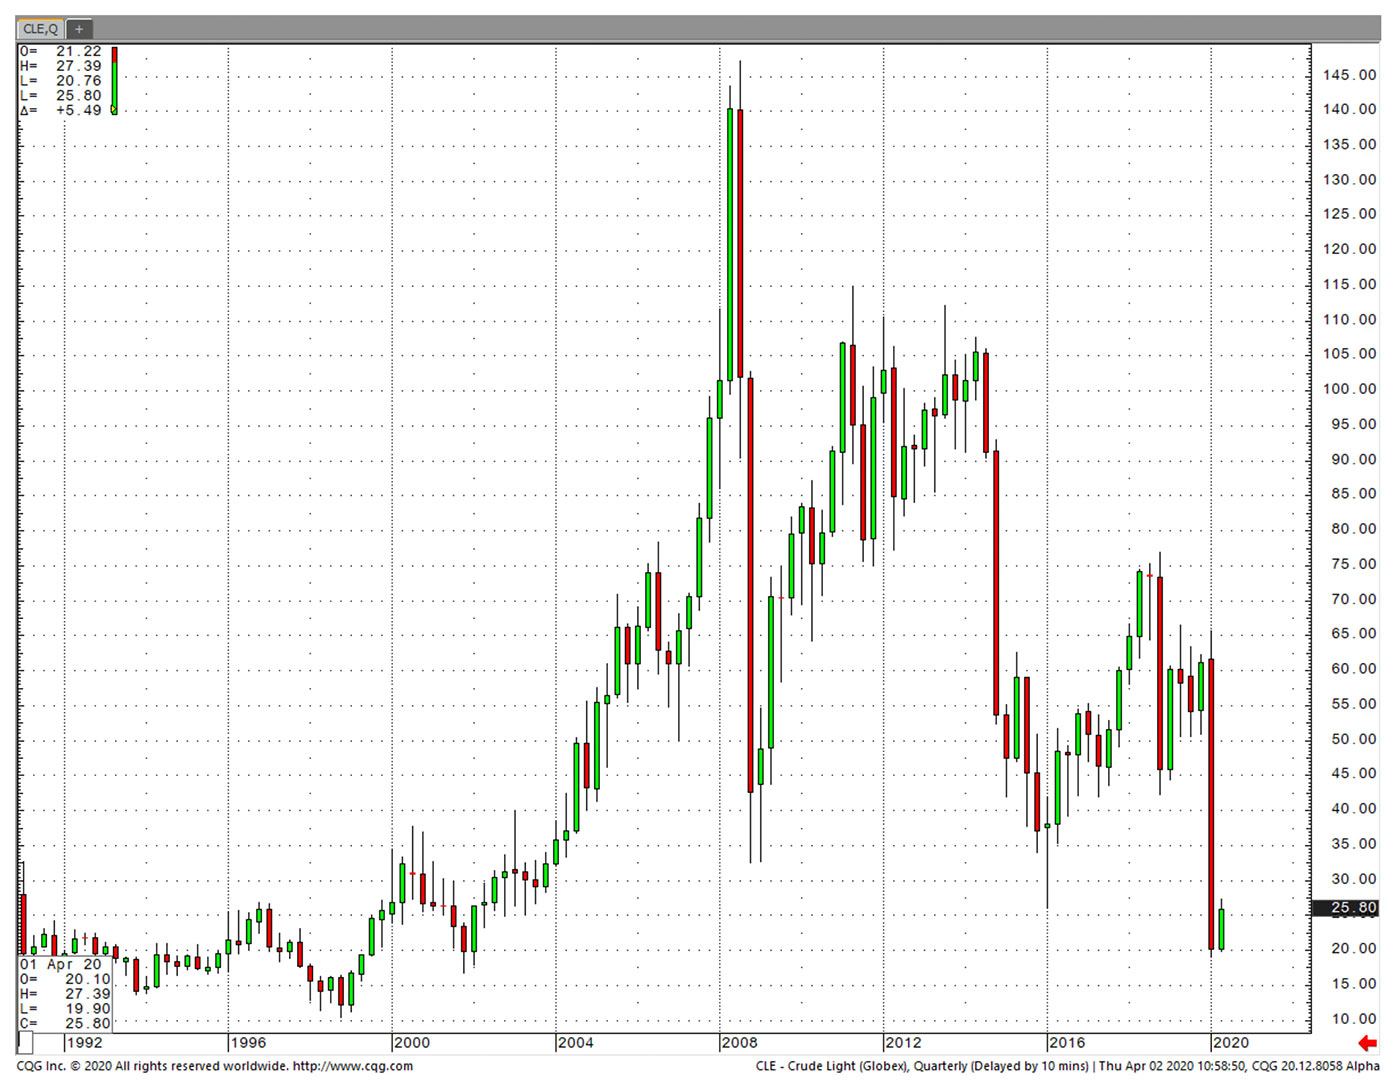
Sources: Market data, charts from cqg.com. Data through 4/2/2020.
How could we foresee the potential for a move below $10 with crude trading above $20 at the time of the article?
Did we gaze deep into the technical crystal ball, calling upon ancient market spirits? Did we offer a figurative sacrifice to Robert Edwards and John Magee—who wrote one of the most acclaimed volumes on technical analysis some 70 years ago—in exchange for the inside scoop?
The bad news is that we don’t possess any special powers to conjure up a market insight. The good news is the basic technical tools used to arrive at those conclusions about crude oil can be acquired and honed by all. (Check your ego at the door, please.)
In my former role as the CMT program director and, currently, as a member of the CFTe program’s education committee (International Federation of Technical Analysis), I’ve always advocated the KISS method, Keep It Simple Stupid.
There are a few basics that can help you avoid potholes and risk in the markets. The first and most important thing any investor, CFP, or wealth manager needs to understand is where on the chart buyers and sellers will appear. Technical analysis can help you answer both questions. Whether the financial instrument is a stock, bond, or futures contract, this analysis will help you understand the issues under investigation.
There are three phases all seasoned technicians seem to have gone through:
- Trying out every far-flung indicator they can find.
- Building their own indicators through trial and error.
- Throwing #1 and #2 in the proverbial junk bin and going back to the tried-and-true technical basics of analyzing support, resistance, and trend lines.
Most charting platforms offer a wide array of studies. While the analytical tools of MACD (moving average convergence divergence), stochastics, RSI (relative strength index), and so on all have their place, what is most important is basic technical analysis, and the most basic of all is identifying the trend. Start with support, resistance, and trend lines, looking for recognizable patterns, and confirm with your favorite indicators.
This order and combination start with a view of the forest before examining the trees.
Markets have three directions: up, down, and sideways. In an up market, the highs are getting higher and the lows are getting higher. In a down market, the highs are getting lower and the lows are getting lower. Finally, in a sideways market, the market is range-bound, going nowhere.
The first step when approaching a chart is to determine which kind of market you’re in—up, down, or sideways. The trend of the market is not absolute; you may have a long-term uptrend with a tactical downtrend. Establishing your time frame and how trends of different time frames intersect is an important basic step.
Once your time frame and basic direction are established, dig deeper into the charts.
For example, in a downtrend, we look for “climax” lows that connect to create a trend line. Our rule of thumb is to use three higher closes to help identify a potential change in trend; however, this is more of an art than a science. A mistake many analysts make at this point is telling the chart what they want to see. Sometimes, there isn’t a trend and support/resistance isn’t obvious. Let the chart tell you what it’s doing, not vice versa. With the availability of countless stocks, currencies, commodities, and ETFs, there is no reason to get too focused on an instrument that doesn’t have a clear story to tell.
Once your trend line is in place, it becomes a line of demarcation. The longer this barrier is in place, the more we trust it. However, once it is violated we look for confirmation signs that the trend is changing. As a wealth manager in my former life, I would wait for a trend line to be violated for two consecutive days. Day traders may use a certain percentage below or above support/resistance; those watching broad indexes and ETFs may look at relative charts. These rules apply to both uptrends and downtrends.
In all kinds of market conditions, whether sideways, breakouts, or breakdowns, I have always relied mainly on horizontal lines to find support and resistance. These are a technician’s bread and butter. With WTI crude oil, for example, I looked last year at monthly and quarterly charts after the initial breakdown to see where closes and highs amassed in the past to determine where support might come in. With both horizontal lines and trend lines, we highly suggest a less rigid approach. Lines get violated here and there. But so long as they do a reasonably good job of identifying highs or lows, we think they are defensible.
Figures 2 and 3 highlight examples of horizontal lines on two different charts for crude oil. Notice the horizontal lines are drawn as previous support/resistance as seen on the chart. Figure 2, a weekly continuation chart, shows clearly that the next resistance line in crude oil is $66–$68. From there, there will be resistance at $75–$76. Figure 3 is a more historical chart flagging a longer-term downtrend. Remember, establishing a time frame is one of the first basic steps.

Sources: Market data, charts from cqg.com. Data through 3/4/2021.
Figure 2 indicates how real the danger was for crude oil back in March–April 2020 and why I made the call for potentially much lower prices at that time. The trip to negative territory—surprising as it was to many—was clearly a possibility when long-term support at $10 did not hold.
Figure 3 is a monthly continuation chart of crude oil. It indicates that crude could visit $75–$76 in the not-too-distant future. That level was last seen in July and September 2018 and was found by using horizontal lines on the continuation chart.

Sources: Market data, charts from cqg.com. Data through 3/11/2021.
As a professional, I use studies such as stochastics, CCI (commodity channel index), RSI, and Bollinger Bands—all with modifications from the default levels seen on most software. These indicators will either confirm my trend analysis or perhaps diverge from my charting findings. The divergence of indicators is a serious warning that closer chart investigation is necessary. I do not use the indicators/studies as buy or sell triggers but as an extra seasoning after my technical trend lines come out of the oven.
Keep sight of the forest, there are millions of trees.
(My thanks to CQG Inc. for the use of their charting software for this analysis.)
 Jeanette Schwarz Young, CFP, CMT, CFTe, is the author of the Option Queen Letter, a weekly newsletter issued and published every Sunday, and "The Options Doctor," published by John Wiley & Son in 2007. She was the first director of the CMT program for the CMT Association (formerly Market Technicians Association) and is currently a board member and the vice president of the Americas for the International Federation of Technical Analysts (IFTA). www.optnqueen.com