


The chart of an issue (stock, bond, future, option, index, ETF, etc.) provides a visual representation of all news and information—public and private—related to that issue. With the idea that price captures everything, technical analysis studies supply and demand using visual tools with analytics produced from price and volume data. We attempt to analyze and forecast supply and demand—understanding the chart is a visual representation of what the market believes to be the true value of the stock or other investment instrument.
Technical analysis can be used in many ways to visualize the future direction and possible target prices that likely will be achieved. There are many ways to accomplish the same goal. I will share here my favorites and those that I have used for more than 30 years of trading and managing portfolios.
Simplicity rules
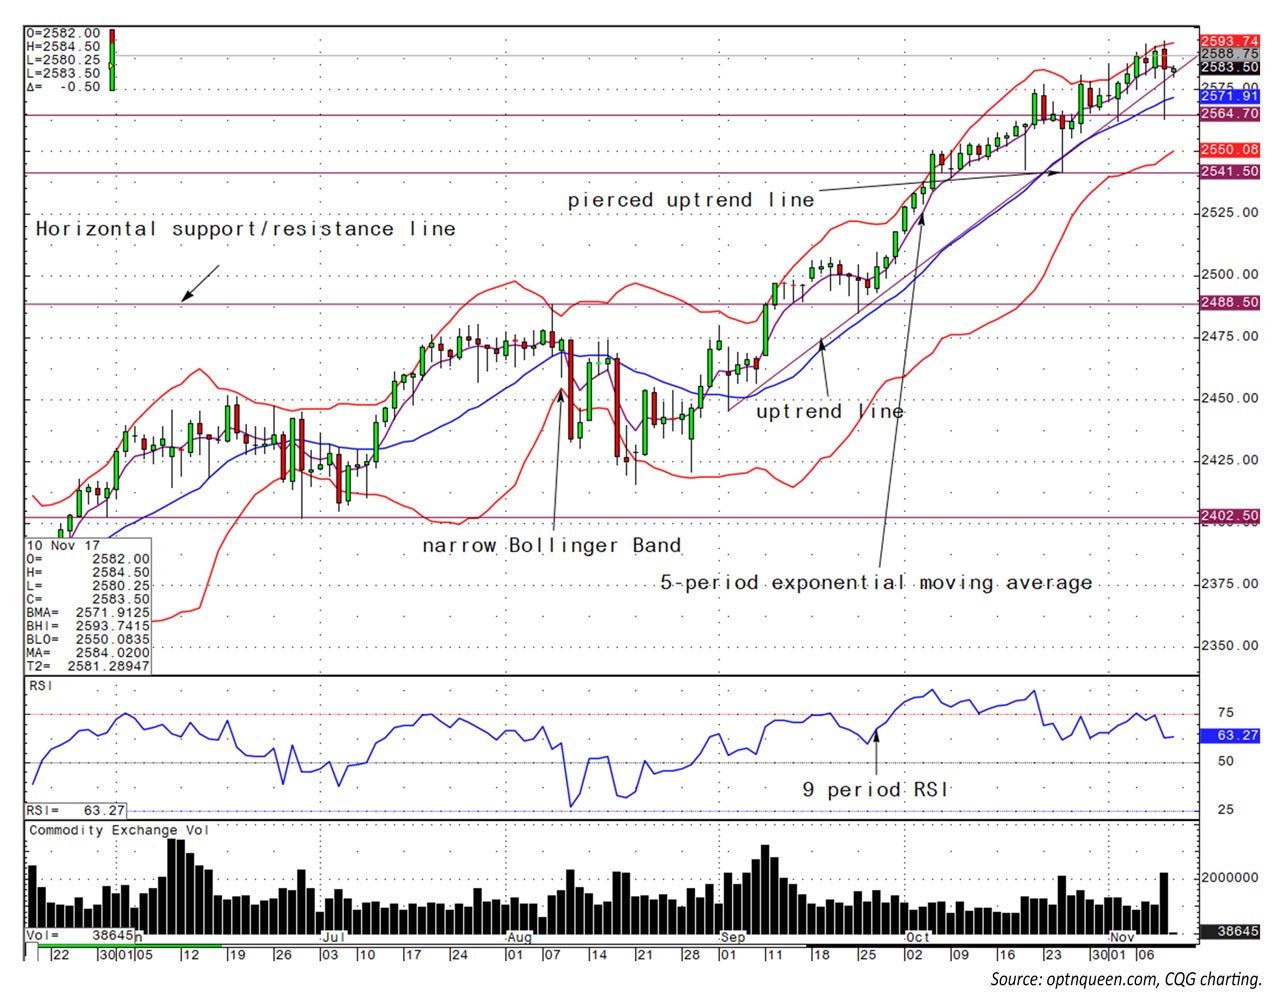
We want to see as much as possible with as little clutter as possible. The cleaner the canvas, the cleaner the analysis. Candlestick charts provide a tremendous amount of information in and of themselves—open, high, low, and close. (See Figure 1.)
From that starting point, Bollinger Bands are added, providing a visualization of market volatility. These bands are two standard deviations wide measured around a 20-period moving average, which works well for the study of most markets. Note: Bollinger Bands are a means of studying market volatility with mean reversion in mind, so the number of trading periods it takes volatility to move from peak to trough is of particular interest in period selection.
With measures in place to study price movement itself and volatility, we need a tool to assess momentum. The Relative Strength Index (RSI) measures the strength of up days versus down days over a given period. I have found that a nine-period RSI tends to work better than the default 14-period RSI. Why? Because it is more sensitive. And while the rest of the traders are using the default, the nine-period RSI can allow you to jump ahead of the crowd.
A five-period exponential moving average is a great guide to keeping you long or short. Here’s the rule:
- Above the five-period moving average, you stay long.
- Below the five-period moving average, get out or just go short the market.
I have found that this works like a charm across various financial products and industries. This is, of course, a very short-term trading tool.
The saying is that “the trend is your friend.” Here is how you can discover what the trend is. It is generally accepted that you connect the top/bottom three points on the chart. In other words, draw a line in a rising market that connects at least three of the recent highs, and the reverse in a declining market, connecting at least three of the recent lows. Is there a consistent visual trend that confirms direction? You can use a short-term trend line, medium-term trend line, or a long-term trend line. Many times, although I might be using a short-term trend line, I look at the longer-term trend lines just to make sure that the medium and longer trend are in the same direction.
Once the direction has been established, the rest is rather easy. Here are a few rules to live by:
- Any piercing of either an uptrend or downtrend line must last two days to be a valid sell or buy signal. (This is our own rule.) A sell signal piercing, such as the one seen on October 25, 2017, was not valid because it was rejected by the market, and that decline met buying interest, which pushed the trade to close above the uptrend line. This probably goes back to the floor trading of the past, when the traders would wait for a violation like that and put on the opposite trade, called a contra- or mean-reversion trade. In other words, if the market broke down, they would buy it. If the market broke out to the upside, they would sell it. The traders also tended to go with the trend as the market came near an uptrend or downtrend line.
- Generally, an uptrend or downtrend line will be tested if the market is near that line. Why? To find out where the “protective stops” are resting. This continues today even in our automated, computer-driven markets (and perhaps the practice has even been used more extensively and with more accuracy in recent years).
- Horizontal support and resistance lines work well in defining the top and bottom of the range.
- The distance between the bottom of a range and the top of that range can be added to the new high to obtain a minimal target for the next leg up. If it is a leg down, subtract the range from the support number found with the horizontal line. Based on this, a reasonable target for the S&P 500 December futures contract is 2,612.
- Volume is necessary for a breakout either to the upside or the downside.
We also recommend using multiple chart forms, not just candlestick charts. Market profile and point-and-figure charts are very useful. Using multiple time frames, such as intraday, daily, weekly, and monthly charts, is also valuable. Putting the action of a daily chart into a longer time frame can help to determine the trend of the market.
There is no free lunch regarding analysis of the markets. It is important that you understand the basics and can do your own fundamental analytical work. If you can visualize the current structure of the market trend, you will have far more confidence in managing your positions.
FIGURE 1: S&P 500 CANDLESTICK CHART WITH TREND LINES (MAY–NOVEMBER 2017)
The opinions expressed in this article are those of the author and do not necessarily represent the views of Proactive Advisor Magazine. These opinions are presented for educational purposes only.
 Jeanette Schwarz Young, CFP, CMT, CFTe, is the author of the Option Queen Letter, a weekly newsletter issued and published every Sunday, and "The Options Doctor," published by John Wiley & Son in 2007. She was the first director of the CMT program for the CMT Association (formerly Market Technicians Association) and is currently a board member and the vice president of the Americas for the International Federation of Technical Analysts (IFTA). www.optnqueen.com