


I have written about crude oil, West Texas Intermediate (WTI), in the past, hopefully adding some color to the analysis of the product. Recently, amid the COVID-19 pandemic, the Russians and the Saudis decided to start a crude-oil price war. It is not like there was excess demand for the product—there wasn’t—but it seems to have been an orchestrated effort by the two oil giants to get rid of the “shalers” once and for all.
As an outsider and technician observing the chaos, I know—to state the obvious—that demand pushes price and lack of demand depresses price. During a pandemic with factories closed and travel plans abandoned as the globe virtually shuts down, excess capacity, or supply, destroys price.
What will the result be? Well, at some point, demand will probably return. At that point, supply will have decreased (especially if the Trump administration can successfully negotiate some sort of arrangement between Russia and Saudi Arabia). And … guess what? Prices will rise. Think about the supply chain. If not for the government stepping in to prevent price gouging, the price of ventilators would surely soar even more than it has now, given the intense demand.
Where can crude oil go? The charts presented here show that crude oil can go to $10 a barrel or slightly less! What!? That level was last seen in 2000. Can we drop to that level again? Sure. It all depends on supply and demand. With oil tankers parked in harbors with tanks full of crude oil, it doesn’t seem likely that we are going to run out of supply for a long while.
A recent article in Foreign Affairs had these observations on global oil supply and demand:
“The resulting collapse in demand will be bigger than any recorded since oil became a global commodity. Oil prices are already down two-thirds since the beginning of 2020 and still falling. The decline in global consumption in April alone will be seven times bigger than the biggest quarterly decline following the 2008–9 financial crisis. …
“The resulting shutdown of much of the global economy has generated a collapse in demand on a scale the world has never seen before. In April, the decline could be 20 million barrels per day or more—about 20 percent of total demand. Even as demand craters, oil will still flow out of wells; if it doesn’t go to consumers, it has to go somewhere—and that means into storage, primarily tankage spread around the world. On a country-by-country basis, IHS Markit calculates that virtually every available gallon of storage space in the world will be full by late April or early May.”
The biggest problem, as noted above, is demand. Here in the U.S., and many places around the globe, business activity and manufacturing will be severely depressed and the winter heating season is over. We are going into the spring and summer driving season, but guess what? With COVID-19, we all probably won’t be going anywhere, anytime soon, even if some states’ travel restrictions were not in place. National parks are closed, beaches and playgrounds are closed, and hotel reservations, vacation plans, college visits, and conferences have been canceled. How can we take an automobile, plane, or train trip sitting less than 6 feet away from the other passengers? Virtual road trips, museum visits, and foreign “travel tours” are suddenly becoming the hot new trend.
Figure 1 is a very long-term chart of crude oil (WTI). I took it back to the 1990s, where you see a clump of support in the $10 area toward the end of the decade. The price decline was due to abundant supply. Then, once the millennium (Y2K) didn’t actually blow up the world and OPEC got a better handle on coordinating production levels, crude oil took off to the upside. The commodity markets are generally more manic than anything else, and this long-term chart illustrates that fact—with a range on WTI of around $10 per gallon to the $145 level.
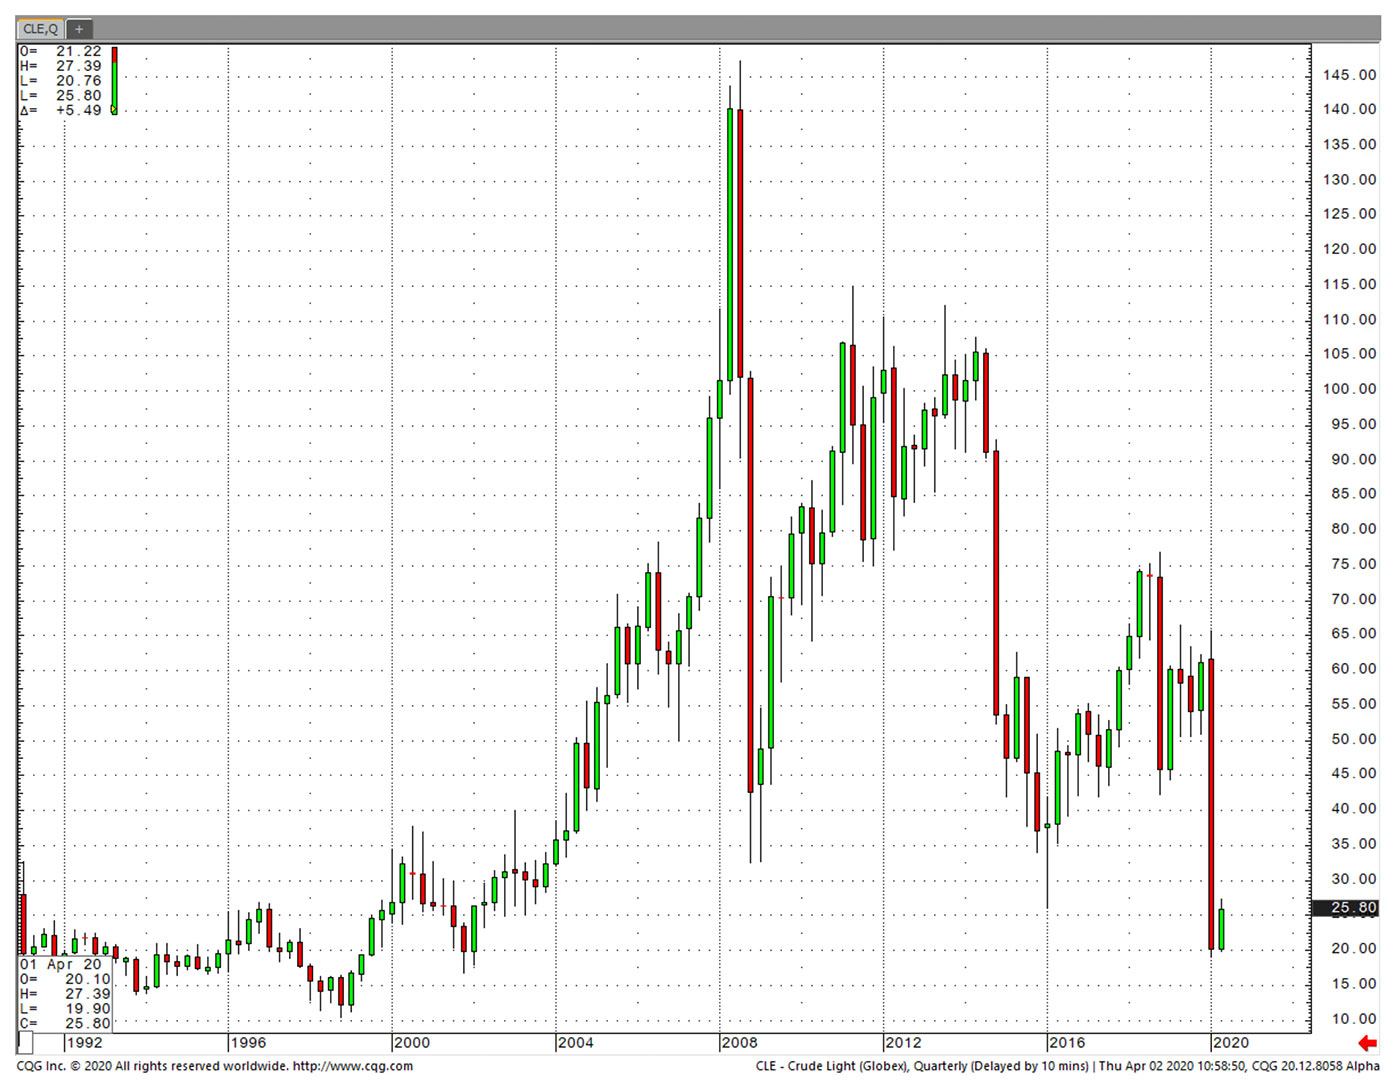
Sources: Market data, charts from cqg.com. Data through 4/2/2020.
Figure 2 is a monthly chart covering 2011–2020. I included volume bars on the bottom, as well as horizontal resistance/support lines. I also included Bollinger Bands, which I find very useful for looking at a current likely price range based on a statistical analysis of volatility.
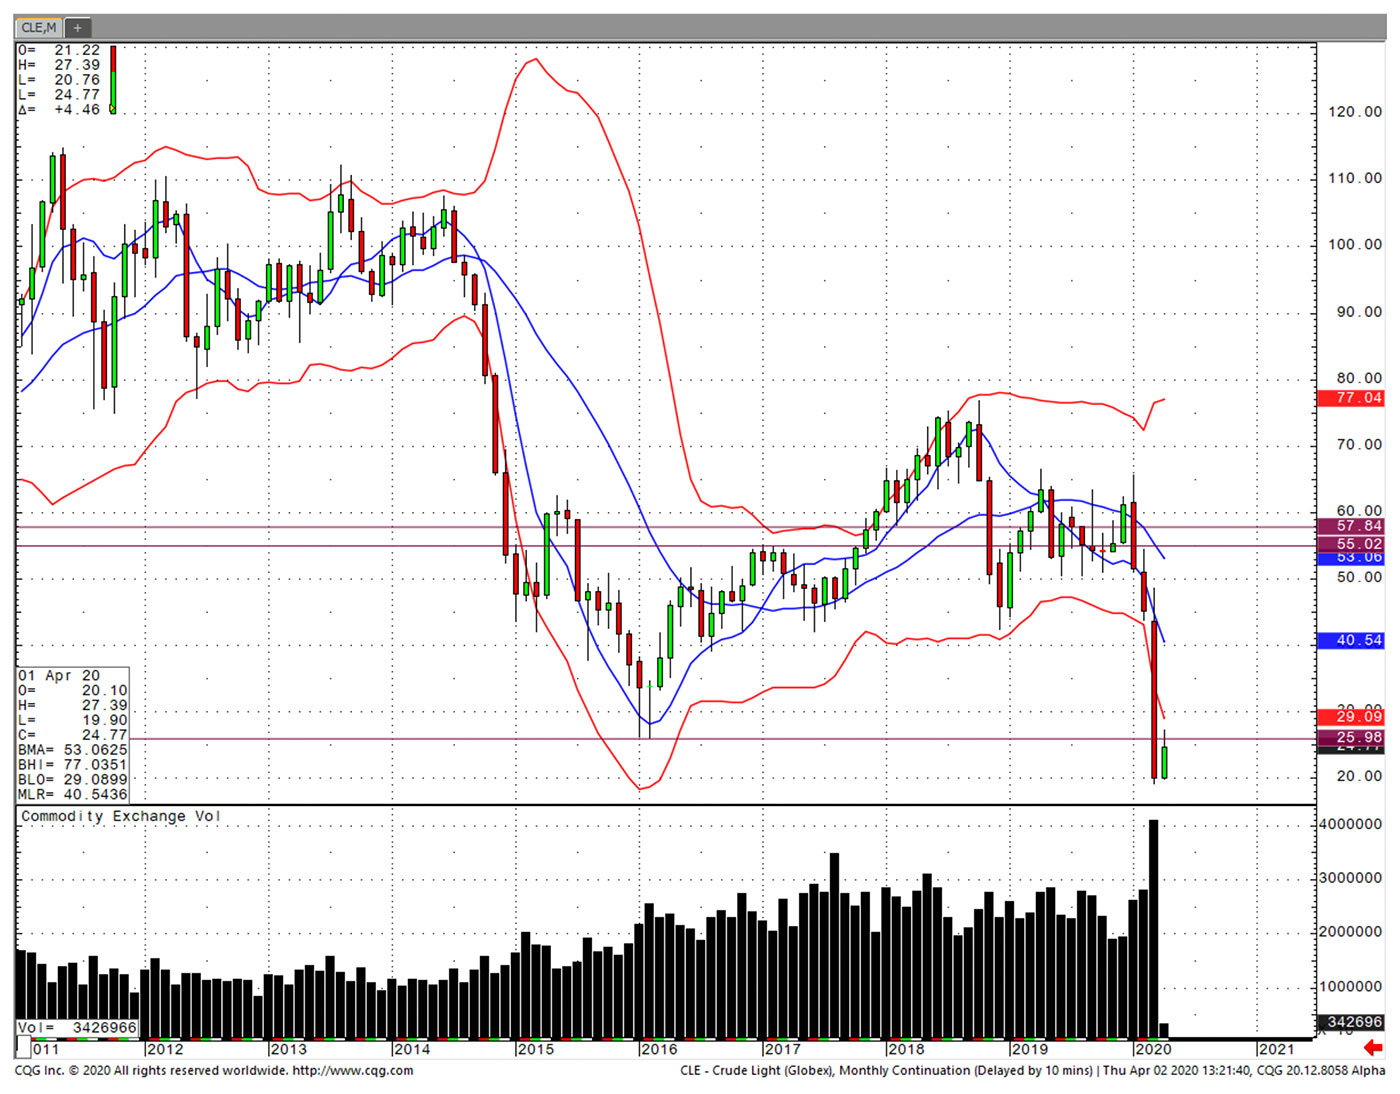
Sources: Market data, charts from cqg.com. Data through 4/2/2020.
Figure 3 provides a much closer look at WTI price, using a weekly chart and shorter time frame. The price spike on Thursday, April 2, was likely a result of short-covering and the reports out of Washington that the Trump administration would be trying to persuade Saudi Arabia and Russia “to declare a ceasefire and reverse the export increases that have drowned the global market in crude.”
This chart shows how dramatic the recent action of crude oil has been. It is always important to review charts in a progression from longer term to short term. I usually use daily and intraday charts for actual trading purposes.
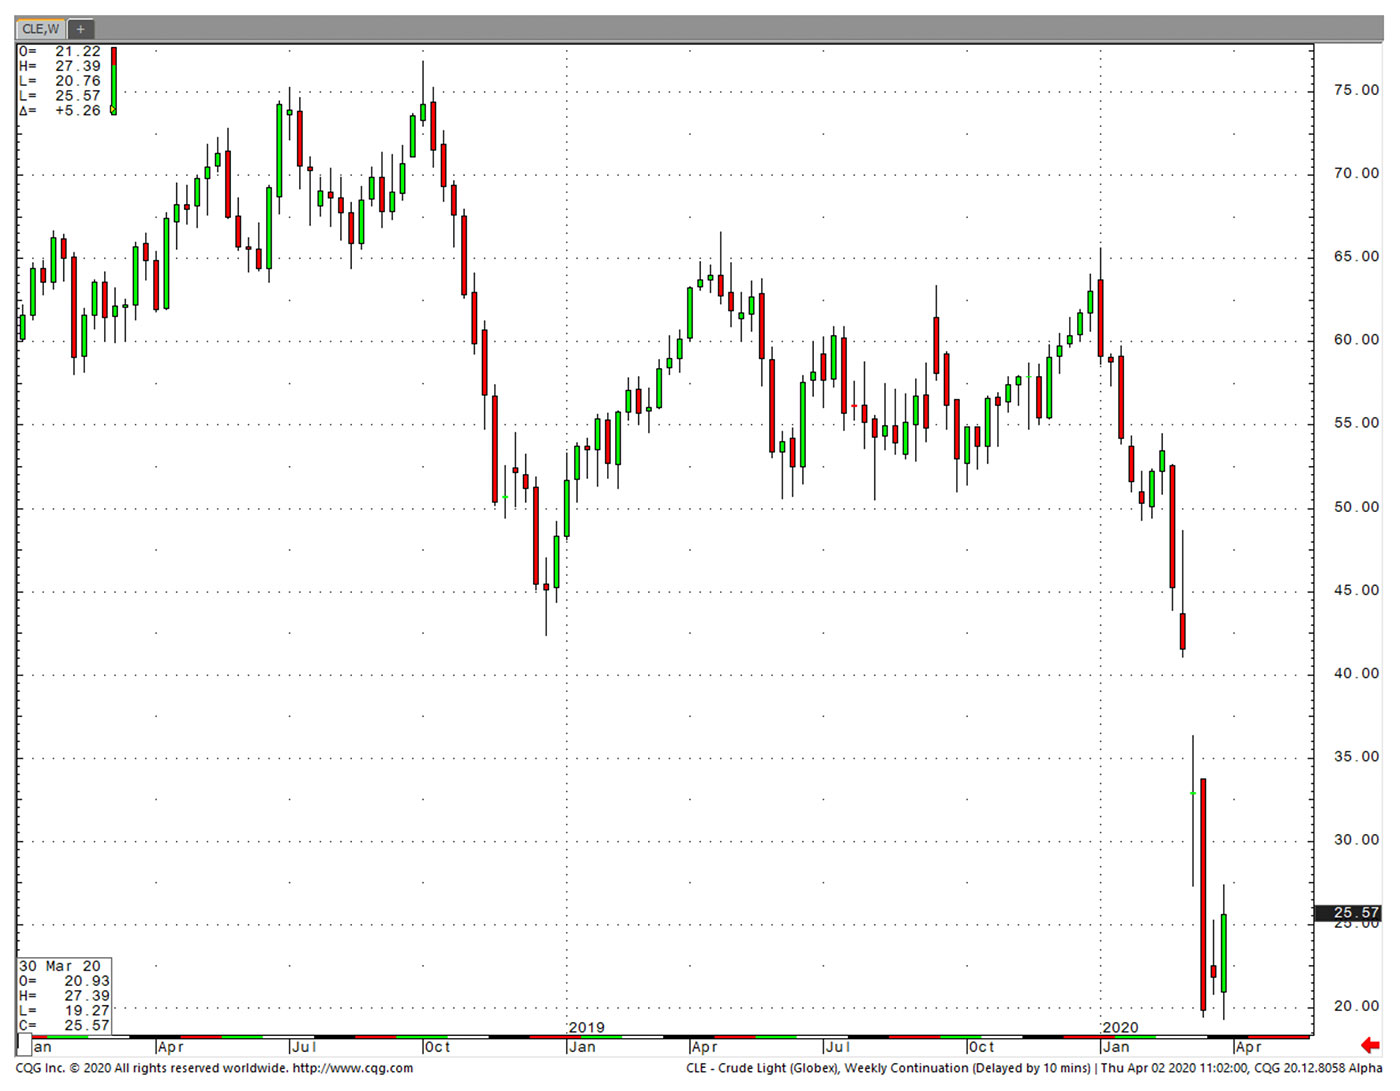
Sources: Market data, charts from cqg.com. Data through 4/2/2020.
I had to use the quarterly and semiannual charts to find support in WTI at the $10 level. This was last seen in 2000. Can we drop to this level again? Sure. It all depends on how much the world’s demand for crude dwindles. In this week’s price action through Tuesday (4/7), crude oil (WTI) was trading between $24 and $28. The fate of the U.S. shale oil production industry, a highly leveraged group, is one of the key reasons the U.S. is trying to take action.
A recent Forbes article articulated the issue this way:
“The real consequences of letting the U.S. shale industry fail is to hand global control of oil production back to Saudi Arabia. Millions of Americans will lose jobs, domestic oil production will fall, and our oil imports will soar.
“Saudi Arabia will then be free to once again withhold production to drive up the price.
“Some producers will go bankrupt as a result of the current crash. And those that made really poor decisions should go bankrupt. But letting too much of the industry fail will begin toppling dominoes that will have enormous ramifications on the U.S. economy and on our national security.”
 Jeanette Schwarz Young, CFP, CMT, CFTe, is the author of the Option Queen Letter, a weekly newsletter issued and published every Sunday, and "The Options Doctor," published by John Wiley & Son in 2007. She was the first director of the CMT program for the CMT Association (formerly Market Technicians Association) and is currently a board member and the vice president of the Americas for the International Federation of Technical Analysts (IFTA). www.optnqueen.com