
Well, we are in the early parts of the old annual bullish season: the period of buying near the holidays and holding until the end of May that has been magical for returns for decades and decades.
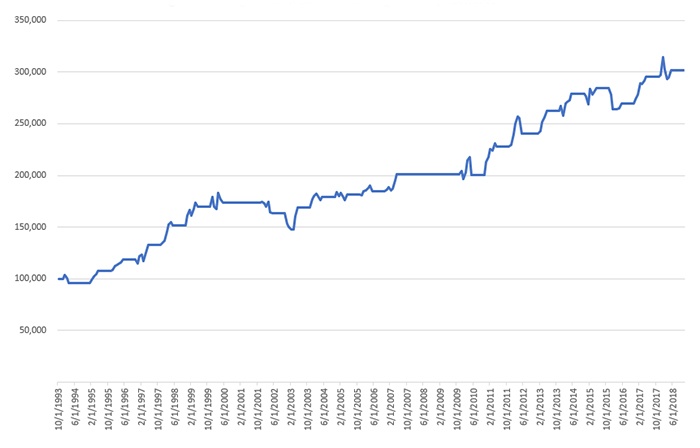
If you traded SPY or bought an S&P 500 mutual fund, it worked extremely well in the seasonal cycles beginning November 1994 to the end of May 1999—producing double-digit returns for five consecutive cycles and averaging 16.72%. Then something happened.
In the cycles from November 1999 to May 2006, returns were in the single digits—and the November 2001–May 2002 cycle produced double-digit negative returns. November 2006–May 2007 was a good year. As you would expect, the returns during the November 2007–May 2008 and November 2008–May 2009 cycles were poor.
To sum up, November 1999–May 2009 averaged a gain of only 1.97%. So, the buy at the beginning of October (for those who braved bottom fishing) or at the beginning of November really had not been exciting for about a decade. Then, something happened again. Starting in the cycle of November 2009—all the way up to the end of May 2018—there were nine consecutive years where the old “December–May” adage worked. They were not nearly as exciting as the cycles of the 1990s—but this period averaged 8.23% each cycle.
FIGURE 1: AGGREGATED EQUITY CURVE FOR SPY (DEC.–MAY CYCLES FOR 1993–2018)
$100,000 invested in 1993

Source: Market data, kensingtonanalytics.com
Some market indicators are now calling “all in” and some are calling “all out.” Clearly, there has been a new injection of volatility into the markets (I’m using S&P 500 as a proxy) due to the tech retreat, concerns about trade wars, overall lackluster breadth, etc., etc.
Some technical measures that have helped me bypass most of the deep drops in past market declines are giving me caution. Specifically, the rolling 13-week ulcer index has continued to increase each week since its market exit on Sept. 28, 2018. This indicator measures relative drawdown risk and has been very accurate in helping investors move to the sidelines during major market turns to the downside. Ironically, it is not very good at “catching the bottom,” so it is one of many defensive indicators in a diverse grouping that I look at.
Another indicator that has my attention is the four-week moving average of the rolling 26-weekly trailing returns. It historically bypasses most damage when markets are in a free fall. It is close to negative right now. Unlike the ulcer index warning indicator, it does a good job keeping you in nicely behaved markets when it is positive. Finally, a rolling 21-day trailing return indicator is showing a range of eight to 11 days of either greater than 1% gains or greater than 1% losses since Oct. 26, 2018. Exceeding 13 out of 21 days above 1% in either direction has historically been bad for the markets.
Back to now. My friend and former business partner from years ago and I used to try to time the bottom of markets in the month of October. It became an annual “fun time.” Astonishingly, in the history of SPY, the only years that the November–May cycles have not had prices lower than the October low are 1993–1994, 2000–2001, 2007–2008, 2008–2009, and 2015–2016. That’s it.
We were definitely onto something.
If you had only traded those cycles, you’d be down 25% since the inception of SPY. Since the market looks pretty tricky right now, I’d keep a close eye on the upcoming months’ lows compared to the low of $259.85 in October 2018. We’ve gotten close to that October low this month. If we breach that low, along with further stress of the indicators shared above, it could get rocky.
Here is one last indicator to consider while navigating the volatile markets for the period of December–May. If the average of the low and the high at the end of the current month is greater than the average of the low and the high of October, hang in there and hold. If it is not, take some money off the table or go to the sidelines.
Have a happy holiday season!
The opinions expressed in this article are those of the author and do not necessarily represent the views of Proactive Advisor Magazine. These opinions are presented for educational purposes only.
 Ian Naismith is a partner and the index designer of Smooth Sailing Indexes Inc., which is a leader in tactical “risk-on/risk-off” index development. Mr. Naismith has been analyzing and trading the markets since the early 1990s. He is a member of the National Association of Active Investment Managers (NAAIM) and has also served as board member and president. www.smoothsailingindexes.com
Recent Posts:
