


Secular or cyclical—investors make money in both, so why care? Well, in one case, fortunes will be built. In the other, buy-and-hold investors are treated to a roller-coaster ride that ends in frustration and little to no financial progress.
Here’s an example: From 2000 to 2011, we were in a secular bear market and experienced 11 years of no financial gain in the S&P 500 Index. Within that secular bear market, we experienced two cyclical bull markets—one from 2002 to 2007 and one from 2009 to 2011—during which the market gained 100% each time. But these cyclical bull markets were just recovering from their prior cyclical bear market declines of 50% (2000–2002 and 2007–2009).
Real wealth-building occurs in secular bull markets. The last one in the U.S. (from fall 1982 to spring 2000) saw gains of more than 1,400%. A new secular bull market for the U.S. started on Oct. 3, 2011, and is still in its infancy with just a 121% gain.
While we have been in a new secular bull market for years, we have been alone. Other developed countries, as well as emerging markets, have been stuck in a terrible secular bear market since late 2007. They had no immunity against the 2008 financial crisis, which was the worst economic disaster since the Great Depression of 1929.
We can track the performance of 21 developed countries outside the U.S. and Canada through the MSCI EAFE Index (EFA). EAFE stands for Europe, Australia, and Far East.
The following chart shows the 10-year secular bear market for the EFA. The pattern is similar to other secular bear markets: large sell-offs followed by repeated (but failed) rally attempts (cyclical bull market) to break out to new highs. The U.S. had a similar pattern: a 50% market collapse in 2000–2002 followed by a move back to its previous high in 2007 that failed to really break out. The same pattern repeated again in 2008–2009: a 50% market crash followed by a 2009–2011 rally back to the old highs. It wasn’t until 2013 that the U.S. market was finally able to permanently move out of the secular bear market by breaking out, moving higher, and never looking back.
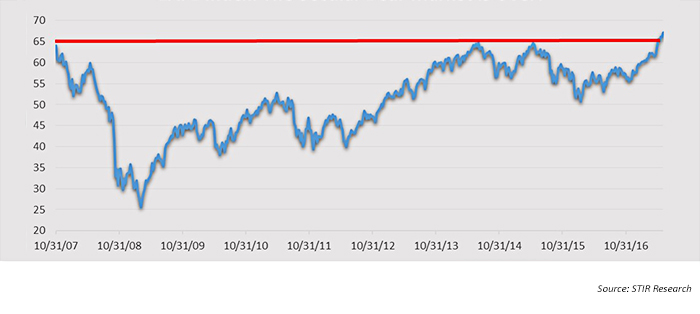
The same is finally occurring with the EAFE Index. After two failed attempts to break out in 2013 and 2014, it has finally broken out and is in the early stages of a new secular bull market. And the timing for investors couldn’t be better. As U.S. markets hit record highs and record valuations, European markets, and those of other developed countries, may offer a bright alternative.
- The U.S. (with dividends) is trading some 95% above its 2007 high, while the EAFE is only 5% higher.
- While Technology is the dominant sector in the U.S. markets at 22%, Financials are number one in the EAFE with a 22% weighting. The Financial sector in the U.S. has gained more than 390% since the end of the financial crisis in 2009. Today, many of Europe’s biggest banking names are trading below their 2009 lows and are just starting new bull-market moves.
- Price-earnings ratios (P/E) are lower: The 2017 forward P/E for the S&P 500 Index is 18.2, while the EAFE is at 15.3.
- Dividend yield is higher, with the EAFE at 3.2%, versus 2.0% for the S&P 500.
- Stronger global growth (3.5% according to the International Monetary Fund) is an advantage for the EAFE. S&P companies get roughly 30% of their revenues overseas, while EAFE countries get closer to 50%.
- Domestic institutional investors’ allocations to international stocks were recently at a 25-year low of 18%, compared to a historical average of 28%.
For the past eight years, U.S. stocks have doubled the performance of their international cousins, and too many investors are making the mistake that this is a given.
I think Barron’s said it well in a recent article, “But history, economic trends, and comparative valuations suggest a leadership change is in the offing, which could benefit Europe and other international markets for a considerable period of time.”
Will we have a repeat of the 2002–2007 bull-market run, where the EAFE Index led with a run of 208%, versus the S&P’s gain of 99%? It’s possible!
 Marshall Schield is the chief strategist for STIR Research LLC, a publisher of active allocation indexes and asset class/sector research for financial advisors and institutional investors. Mr. Schield has been an active strategist for four decades and his accomplishments have achieved national recognition from a variety of sources, including Barron's and Lipper Analytical Services. stirresearch.com