
Editor’s note: Tony Dwyer, chief U.S. portfolio strategist for Canaccord Genuity, and his colleagues author a widely respected monthly overview of economic and market conditions, technical factors, and future market outlook called the “Strategy Picture Book.” The following provides an excerpt from their Feb. 6, 2023, report.
One side of the current market argument is going to see a historic failure.
Either the macro indicators pointing to a recession and a move to the market’s October low are wrong, or the momentum and breadth thrust indicators pointing to a new bull market are wrong.
As we suggested in “Using a slow cooker in a microwave market,” it will take more time to disprove the likelihood of a recession—using the unemployment rate as a guide as to when it begins.
We expected a year-end rally given the extreme whoosh for markets in the fall, and what history suggests following drops of more than 20% in the S&P 500 (SPX) through September.
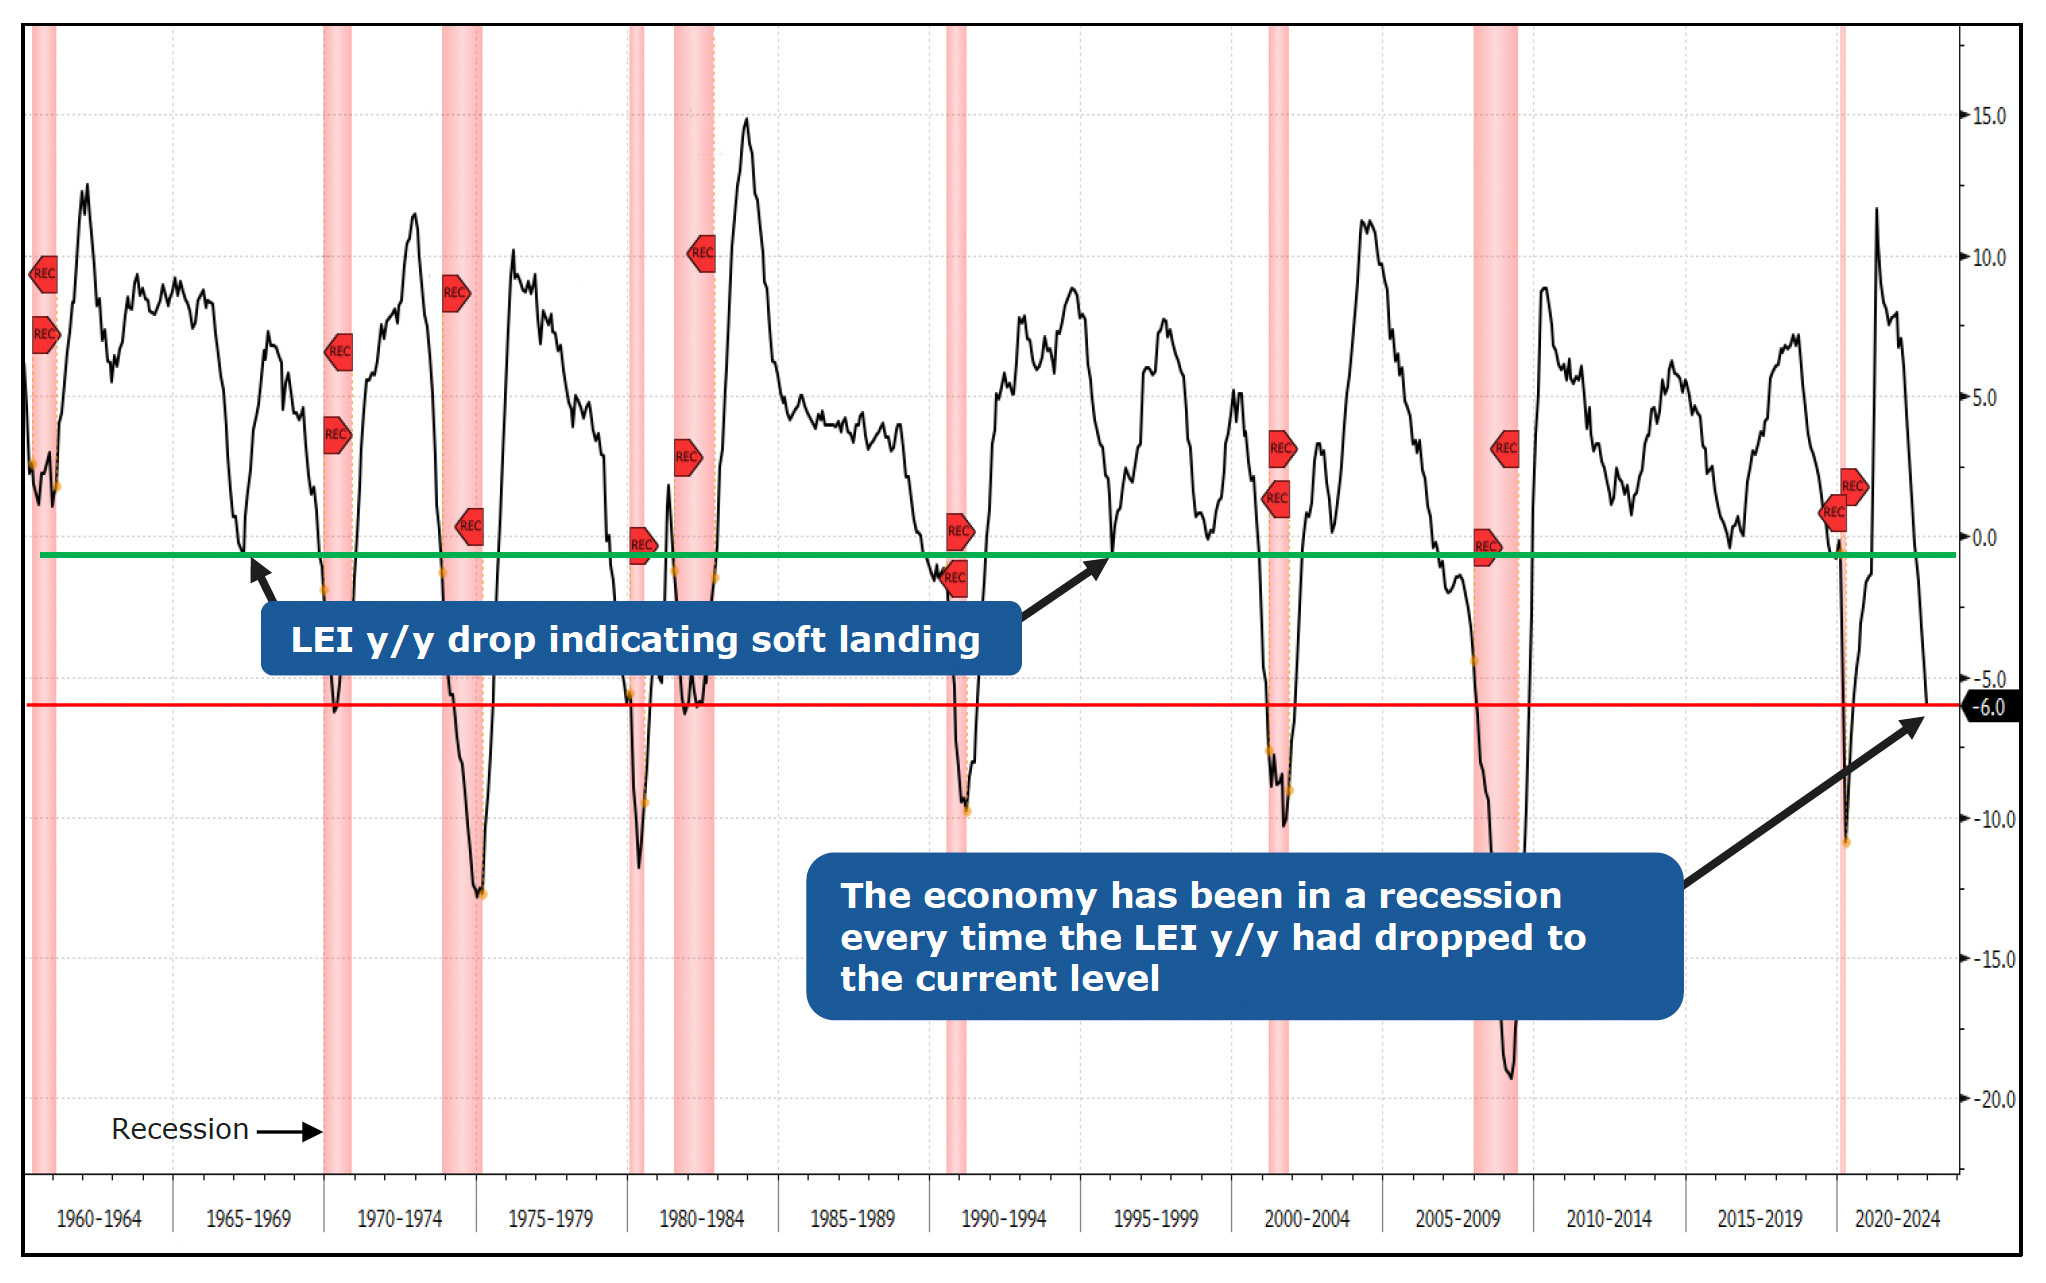
A 25% drop in the SPX off the early 2022 peak was discounting some pretty bad news. But the SPX is up 15% from that level and very near where we adopted a more defensive posture in our December picture book. It has been a powerful rally, driven by expectations for an economic soft landing and a more dovish Fed. The problem is that despite the strong labor market reinforcing the soft landing, the U.S. Treasury yield curve and The Conference Board Leading Economic Index (LEI) have only served to reinforce the recession call.
FIGURE 1: ECONOMIC OUTLOOK—LEADING ECONOMIC INDEX SIGNALING 2023 RECESSION (1960–CURRENT)
Sources: Bloomberg, Canaccord Genuity
How to detect a recession in real time
Historically, an excellent guidepost for an economic downturn is the Sahm rule highlighted by the St. Louis Fed. The Sahm rule identifies signals related to the start of a recession, when the three-month moving average of the national unemployment rate (U3) rises by 0.50 percentage points or more relative to its low during the previous 12 months. This means that if the unemployment rate over the next three months averages 4.0% (up from 3.5%), then we are in a recession.
It really is all about a recession
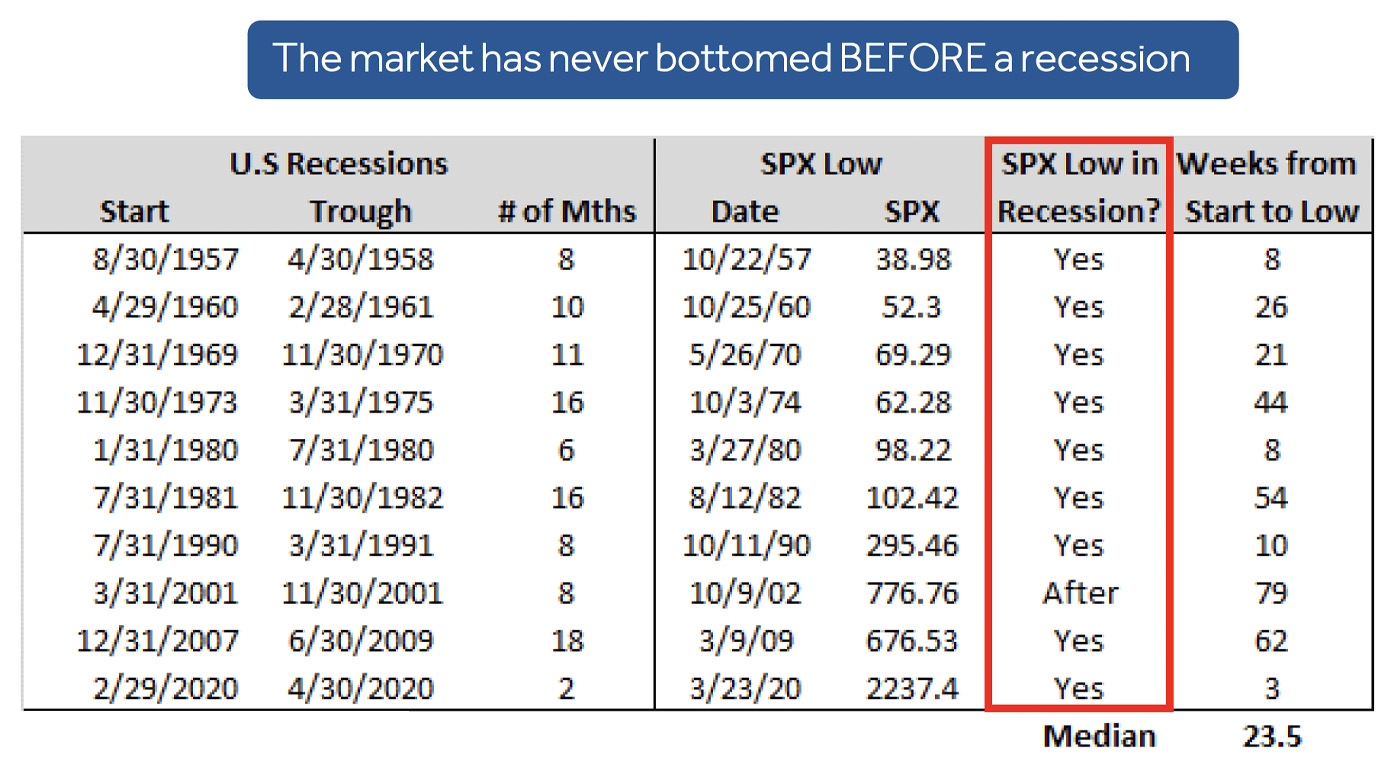
Taking this a step further to see market impact, the median duration between the start of a recession to the low in the S&P 500 (SPX) is 23.5 weeks, with the shortest lead time of three weeks in 2020. Before that, it was eight weeks in 1957 and 1980. This means that if the National Bureau of Economic Research ultimately says the beginning of the recession is now (unlikely), then the market low should happen anytime over the next six months. Clearly, this year’s upside momentum has other ideas. So which one is right—and what is currently being discounted when the SPX is down 13% from its peak rather than the 25% it was down when the rally began from the October low?
TABLE 1: MARKET OUTLOOK—‘THE’ LOW HAPPENS DURING
A RECESSION
Sources: Bloomberg, National Bureau of Economic Research, Canaccord Genuity
For the first time in a generation, you get paid not to guess
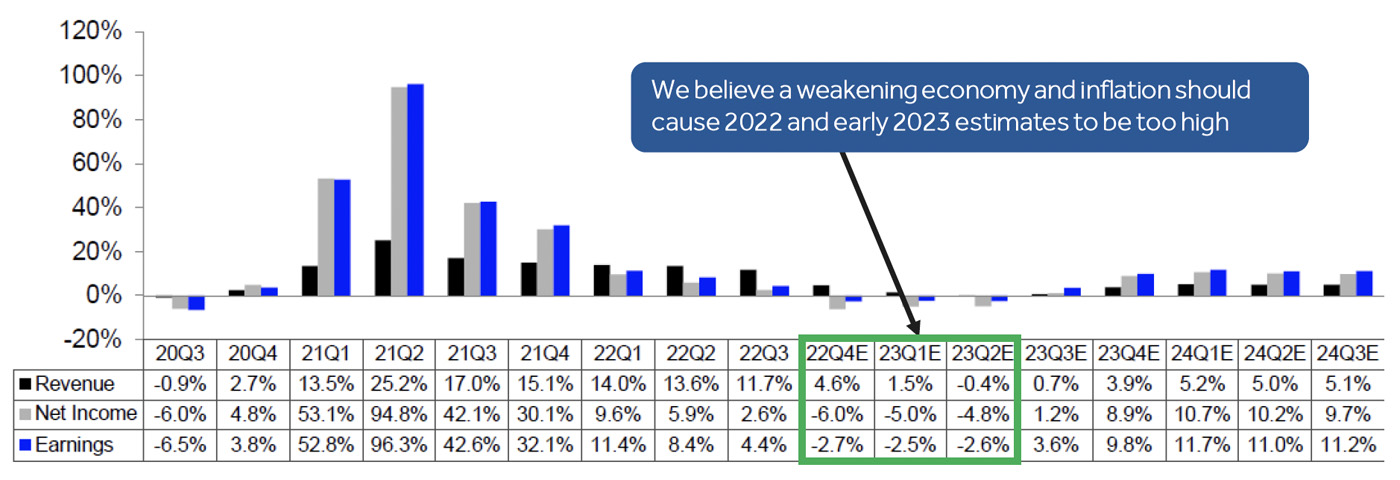
With the market at roughly the same level as it was in mid-December and the SPX earnings yield roughly equivalent to short-term U.S. Treasury T-bills, it makes sense to wait for further economic and market info before taking a more aggressive approach. Figure 2 provides projected S&P 500 (SPX) earnings estimates.
FIGURE 2: EARNINGS OUTLOOK—CONSENSUS SPX EPS SHOULD PROVE TOO OPTIMISTIC
Sources: Canaccord Genuity, I/B/E/S data from Refinitiv
There is no question that there has been a broad and powerful move to start the year for equities. But to believe the rally is sustainable we must disprove the prospect of a recession, and that will take more time.
As we have seen in December and January, volatility can be outsized in both directions. The downside in December was driven by megacaps and information technology, and so was this year’s early upside. Despite the ramp in the market this year based on the hopes for a soft landing, the Industrials, Energy, Materials, and Financials sectors have underperformed the market and given back their relative outperformance since early November.
The opinions expressed in this article are those of the author and do not necessarily represent the views of Proactive Advisor Magazine. These opinions are presented for educational purposes only.
New this week:
 Tony Dwyer is the head of the U.S. Macro Group and chief market strategist at Canaccord Genuity. He also sits on the firm’s U.S. operating committee. Mr. Dwyer joined Canaccord Genuity in 2012 and is known for the practical application of macroeconomic and tactical market indicators. Mr. Dwyer was previously equity strategist and director of research at Collins Stewart and a member of the firm's executive committee. Mr. Dwyer is a frequent guest on many financial news networks. canaccordgenuity.com


