What is driving the surge in precious metals?
What is driving the surge in precious metals?

While often grouped together, gold, silver, and copper play unique roles in the economy: Gold is the focus of national reserve strategy, silver supports both investment and electronics, and copper serves as the backbone of industrial and infrastructure expansion.
In 2025, each of these forces was a defining feature of the economic landscape, helping drive outsized returns in these metals over the year. Over the past month, all three have reached historic price milestones, reinforcing the importance of understanding what lies beneath the rally.
The following sections examine the structural forces behind these moves. The three charts below explore what is driving the surge in precious metals and what it may signal about the broader economy.
Central bank gold purchases
Over 60% of the demand for gold is driven by investors and central banks around the world. During times of heightened political conflict or uncertainty, central banks often turn to gold because of its universally recognized value and lack of counterparty risk.
After the U.S. and its allies froze about $300 billion in Russian foreign exchange reserves following the invasion of Ukraine in 2022, many countries perceived a heightened level of risk in holding foreign exchange reserves outside their borders. As a result, central banks began to accelerate their gold purchases to insulate reserves from political conflict. More recently, major political realignments have prompted countries to keep purchasing at elevated levels to further reduce counterparty risk during political uncertainty.

Sources: World Gold Council, First Trust Advisors. Quarterly data from Q1 2010 to Q4 2025. LBMA is the London Bullion Market Association.
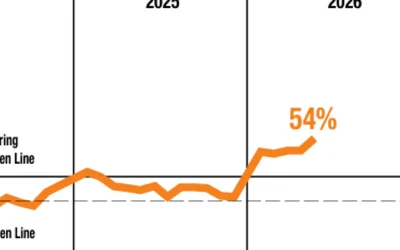
Silver market balance (supply − demand)
The global silver market has been undersupplied for the past five years, as industrial demand has outpaced mine production. Much of that demand has been driven by the ongoing technology buildout, particularly in advanced electronics, where silver’s superior conductivity makes it difficult to substitute.
Roughly 40% of U.S. silver consumption is tied to electronics manufacturing. This growing industrial reliance is particularly significant given U.S. import dependence on the metal. In 2025, 77% of all silver consumed domestically was sourced from abroad. The U.S. silver supply chain is highly concentrated, with imports coming primarily from Mexico (47% of total imports), Canada (18%), Chile (5%), and Turkey (5%).

Sources: The Silver Institute, First Trust Advisors. Annual data from 2016 to 2025.
![]() Related Article: The evidence-based case for an optimal gold portfolio allocation
Related Article: The evidence-based case for an optimal gold portfolio allocation
U.S. copper trade deficit
While silver is used in advanced electronics, copper is more commonly used in industrial applications. About 42% of global copper demand is from construction, with another 23% tied to electronics and electrical equipment.
As large-scale technology infrastructure projects (data centers and semiconductor fabrication plants) have accelerated in recent years, domestic copper consumption has climbed. That increase has pushed U.S. import needs higher and contributed to a widening trade deficit.
In 2025, 57% of copper consumed in the U.S. was imported, up from 45% in 2024. That said, about 30% of the U.S. copper supply last year was recycled from scrap, providing some buffer against international supply-chain pressures.

Sources: U.S. Census Bureau, First Trust Advisors. Annual data from 2010 to 2024 (most recent data available).
Editor’s note: Brian Wesbury is chief economist at First Trust Advisors LP. He and his team prepare a weekly market commentary titled “Monday Morning Outlook,” as well as frequent research reports and the recurring feature “Three on Thursday.” Proactive Advisor Magazine thanks First Trust for permission to republish an edited version of this commentary, which was first published on Feb. 19, 2026.
This report was prepared by First Trust Advisors LP and reflects the current opinion of the authors. It is based on sources and data believed to be accurate and reliable. Opinions and forward-looking statements expressed are subject to change without notice. This information does not constitute a solicitation or an offer to buy or sell any security.
The opinions expressed in this article are those of the author and the sources cited and do not necessarily represent the views of Proactive Advisor Magazine. This material is presented for educational purposes only.
First Trust Portfolios LP and its affiliate First Trust Advisors LP (collectively “First Trust”) were established in 1991 with a mission to offer trusted investment products and advisory services. The firms provide a variety of financial solutions, including UITs, ETFs, CEFs, SMAs, and portfolios for variable annuities and mutual funds. www.ftportfolios.com
RECENT POSTS