

And then, there was light
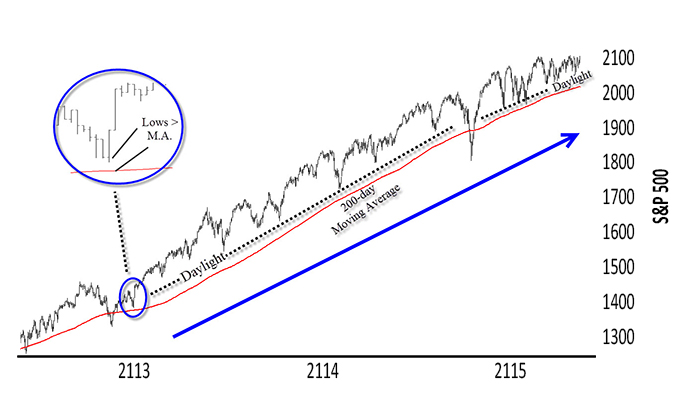
There’s nothing magical about moving averages, but they can help keep you on the right side of the market. Since all price-based indicators have lag, I like to look for patterns in price itself. With moving averages, I like to look for price “daylight.” This means that the price bar lows are greater than the moving average in uptrends. There is “light” between the price bar and the moving average. Now, you certainly don’t want to rush out and buy and sell every time the market crosses the moving average, but paying attention to daylight can help keep you on the right side of the market.
Using this concept, the longer-term trend remains intact in the S&P 500. And, when this occurs you want to err on the side of the longer-term trend. Using the well-watched 200-day moving average, the S&P has had daylight in all but a few days since the beginning of 2012. In this period, the market has gained nearly 70%. “And, counting?” is the $64,000 question.
S&P 500 TREND VS. 200-DAY MOVING AVERAGE
Not getting any brighter—yet?
When it comes to markets, like Janet Jackson, you have to ask: “What have you done for me lately?” And, lately, it hasn’t done much. When I wrote my last column for Proactive Advisor Magazine in February, the S&P 500 was stuck in a range. It was nearing the top of that range, circa 2100, but it was still stuck in a range nonetheless. Fast forward three months and we not only have a “Janet” market but also a “Yogi” one: It’s déjà vu all over again. The index is once again probing the top of its range but it is still in a range nonetheless.
Daylight come and I want to go home—lights out?
Although the major indices remain in longer-term uptrends, bonds have been headed lower as of late. The TLT recently crossed below its 200-day moving average and has had downside daylight (price highs < moving average) since early May. The absolute level of interest rates isn’t as troubling as the delta (change). This fear of sharply higher rates could put pressure on people to sell stocks first and then ask questions later.
The U.S. dollar has also been in a slide. It has had daylight below its 50-day moving average since late April. Commodities seem to be waking up based on this.
Any bright ideas?
The good news is that there are some emerging trends in areas that can trade independently to the overall market while the market finds its way. These include the aforementioned commodities, specifically Steel & Iron, Copper, and the Energies. Other areas that can trade independently to the overall market such as Latin America and second-tier Chinese stocks (i.e., those at lower levels) also have nice trends emerging.
Stay in the light, the light is good
It’s probably a good idea to continue to err on the side of the longer-term trend when it comes to stocks. However, you might want to hold off on being aggressive on new purchases in stocks until the major indices can both break out and hold. In the meantime, focus on the emerging trends in those areas mentioned above that can trade contra to the overall market just in case it’s “lights out.”
The opinions expressed in this article are those of the author and do not necessarily represent the views of Proactive Advisor Magazine. These opinions are presented for educational purposes only.
 Dave Landry has been trading the markets since the early 1990s and is the author of three books on trading. He founded Sentive Trading LLC in 1995 and since then has been providing ongoing consulting and education on market technicals. He is a member of the American Association of Professional Technical Analysts and was a registered Commodity Trading Advisor (CTA) from 1995 to 2009. davelandry.com