Transforming client outcomes: Behavioral coaching and data-driven strategies
Transforming client outcomes: Behavioral coaching and data-driven strategies

Financial advisors can add significant value through behavioral coaching, helping clients understand how the changing nature of risk and return can be managed through data-driven investment decision-making.
Behavioral financial markets
We often struggle to explain why markets and individual securities move the way they do over short periods. This can be unsettling, especially as investment professionals, since our clients expect us to understand and explain what can sometimes seem like unpredictable, even alarming, market movements. The truth is, however, that most individual security and market movements are unexplainable—they are driven by the emotions of the crowd, with no clear rationale behind them.
To fill this information gap, a whole media and professional ecosystem has evolved. Market events are often linked to a single new piece of information or event. People make sense of the world through stories, and the more detailed the story, the more convincing it becomes to the public.
But if we are asked why the market, a stock, or another security moved the way it did on a particular day, the honest answer is often, “I have no idea.” While this may be unsatisfying, it’s a reflection of how emotions, rather than fundamentals, primarily drive financial markets.
Some may feel that admitting the unpredictability of markets diminishes our value as investment professionals, but quite the opposite is true. Acknowledging that much of market behavior can’t be easily explained is the first step toward adding real value. Financial markets are noisy and largely unpredictable, and success depends on not being misled by this chaos.
When an event triggers an emotional reaction—like the unexpected Brexit vote—it’s common for most people to respond in a similar way. This collective response is amplified by herding behavior. In fact, herding can occur even without an external event: We react because we see everyone else reacting, even if we don’t fully understand the reason behind the sudden rush.
When these emotionally driven crowd behaviors hit the markets, they can create buying opportunities for those who remain calm and avoid being swept up in the moment. These behavioral price distortions are the starting point for building successful portfolios.
Reframing market performance
Most people rely on a mountain chart, typically a line or area chart that illustrates an investment’s growth over time, to evaluate performance. However, this presentation emphasizes short-term volatility, specific timing, and emotionally charged events (like 2008), introducing inherent biases that can distort our perception of performance and obscure the true long-term probability of success.
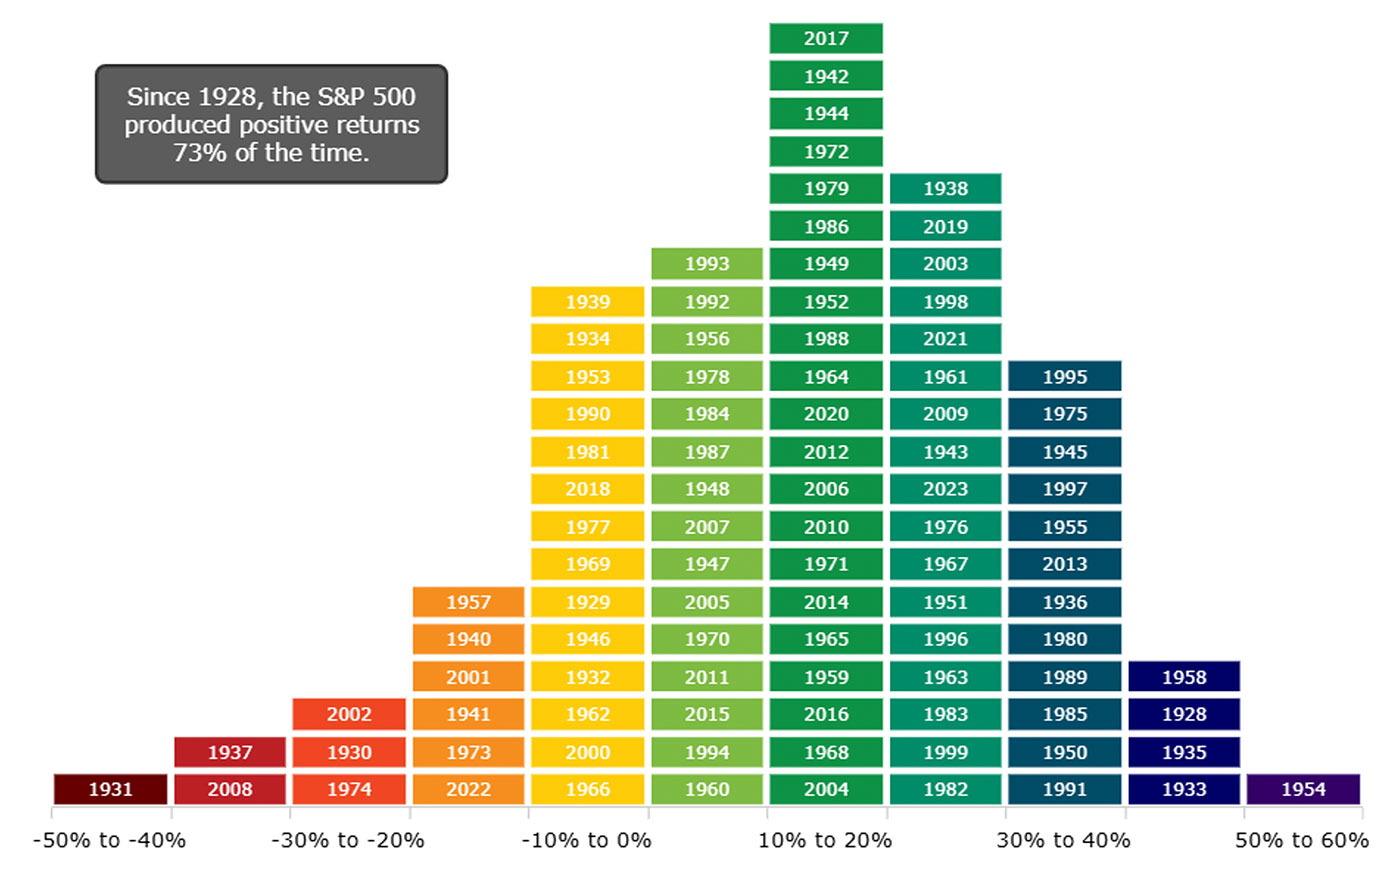
A return distribution, rather than a mountain chart, offers a more effective way to view market performance. In Figure 1, we see the return distribution for nearly 100 years of annual S&P 500 returns from 1928 through 2023. This perspective highlights that there have been far more positive years (represented by values to the right of the yellow bars) than negative ones, with a positive return occurring in 73% of the years. The most common annual return was between 10% and 20%, occurring 21 times, or roughly one out of every five years. These helpful insights are difficult, if not impossible, to gain from a typical mountain chart.
FIGURE 1: S&P 500 INDEX RETURNS BY CALENDAR YEAR
(JAN. 1, 1928–DEC. 31, 2023)
Sources: AthenaInvest, S&P Dow Jones Indices LLC
Another noteworthy observation is that large positive returns tend to exceed large negative ones. This may surprise many, as large negative returns are often emotionally memorable, while comparably significant positive returns are frequently overlooked or forgotten.
Because annual returns are uncorrelated, each year’s outcome can be viewed as a random draw from a broader distribution, like the one shown in Figure 1. In contrast, the mountain chart often leads to hindsight bias and encourages narratives that give a misleading sense of preparedness for future market movements. The reality is that annual returns are inherently unpredictable, as demonstrated by the poor track record of stock market forecasts made at the beginning of each year.
Examining a return distribution provides clear evidence that the stock market rewards long-term investors. This approach offers valuable long-term perspective and reframes performance discussions in terms of probabilities, helping to avoid some pitfalls of the mountain chart. It also reduces the likelihood of strong emotional reactions, which, when tied to specific events, can lead to poor decisions and mistaken conclusions.
Keeping drawdowns in perspective
Market fluctuations are a natural part of equity investing. Still, large declines can be unsettling for both clients and advisors, especially when they happen quickly and seem unpredictable. What’s often overlooked is that, despite significant annual drops, stock market returns have generally been positive over time.
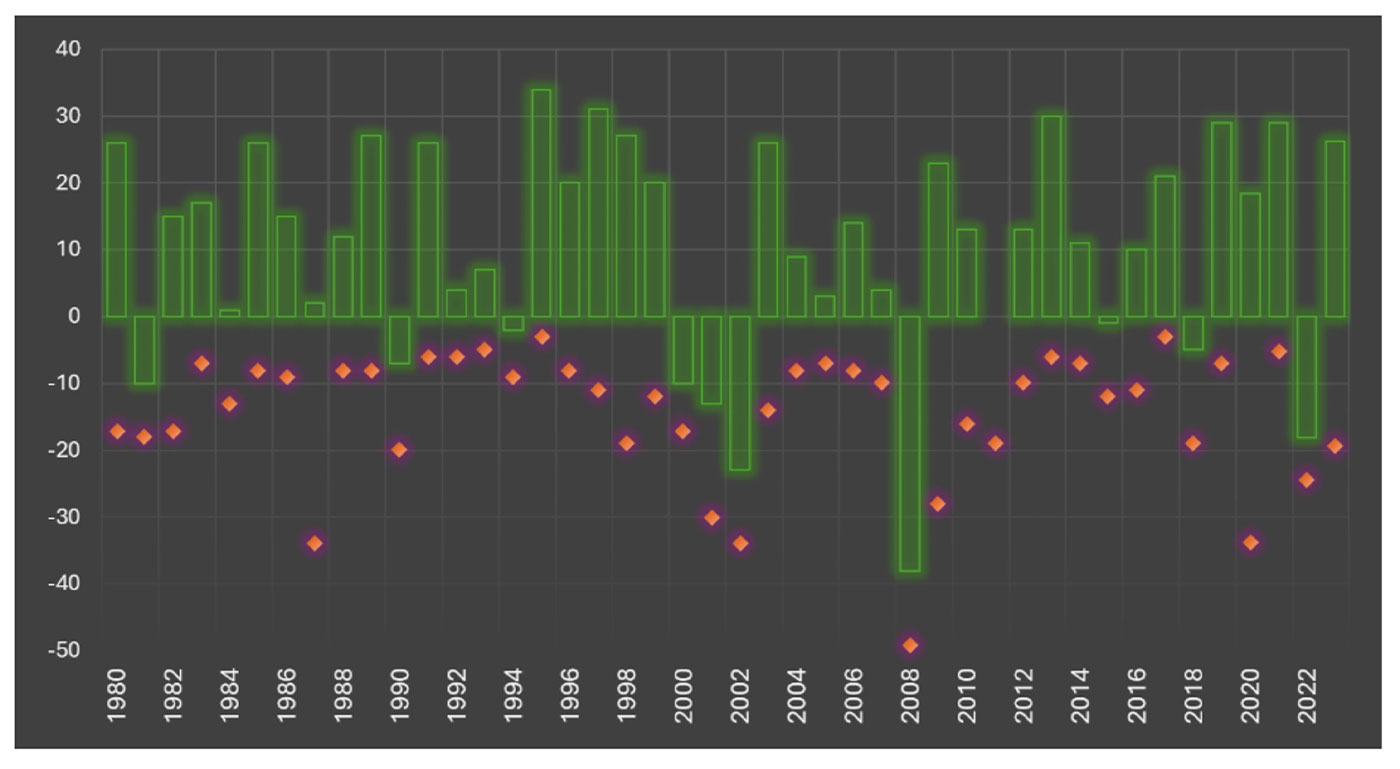
Figure 2 highlights the unpredictable nature of the market, examining stock performance over the past 44 years. It shows the lowest point reached each calendar year (in orange) alongside the full-year return (in green).
FIGURE 2: CALENDAR YEAR RETURNS AND INTRAYEAR DRAWDOWNS OF S&P 500 PRICE INDEX (1980–2023)

Sources: AthenaInvest, S&P Dow Jones Indices LLC, December 2023
Since 1980, the average intrayear decline for the S&P 500 has been about 14%. Despite this, the Index ended the year positively 34 out of 44 times, or 77% of the years, with a compound annual return of 12%.
This chart provides a clear visual of the typical market fluctuations investors can expect. However, emotional responses to these swings often lead investors to sell during downturns. As a result, many miss out on the recovery as the market rebounds. This was especially evident in 2020, when a 34% drop early in the year turned into an 18% gain by year-end.
Stock market returns are rarely smooth, so advisors should manage client expectations and develop a plan for dealing with the inevitable market movements. This should help investors stay the course and improve their long-term returns.
Bears prowling the market
While each bear market is unique, history offers valuable insights into how deep and how long they typically run. It’s important to remember that the stock market’s long-term average annual return of 12% includes all downturns and recessions. Fortunately, investors don’t need to time the bottom of a bear market to achieve long-term success.
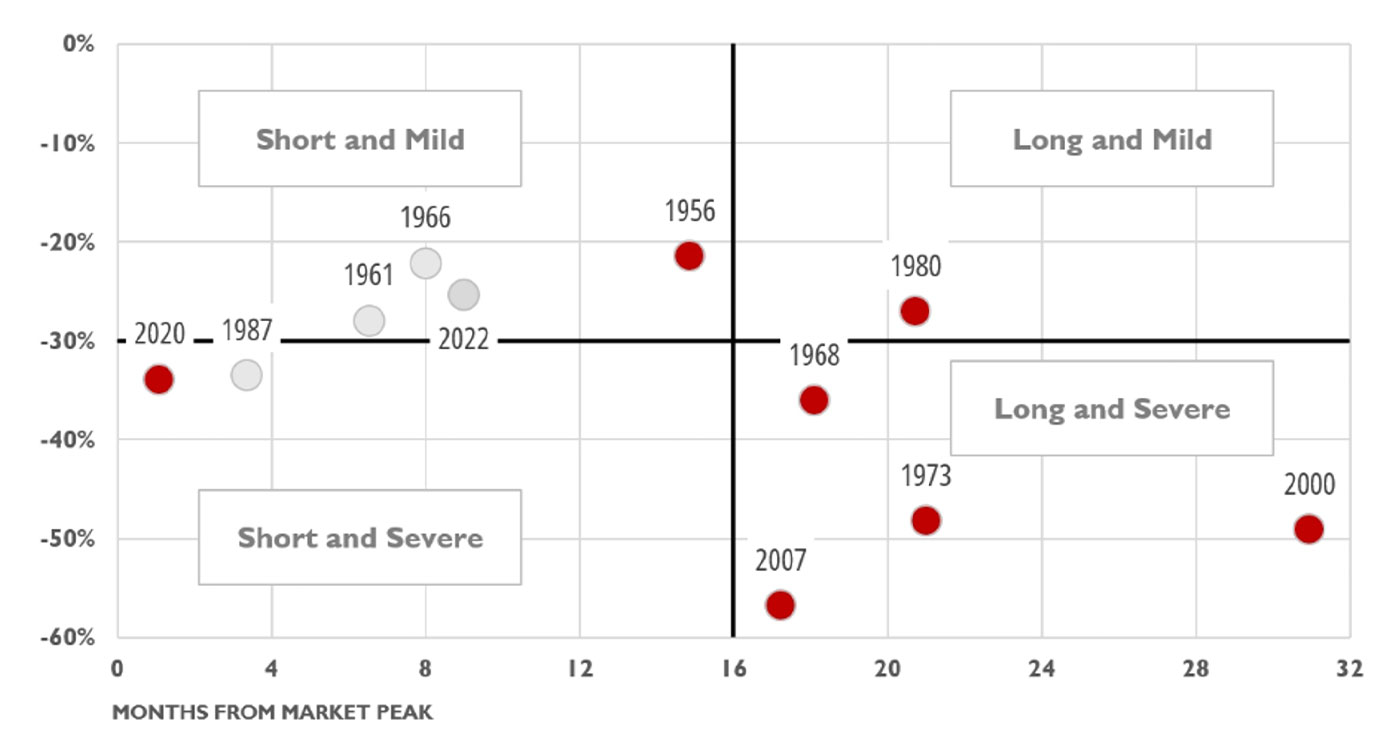
Bear markets are often emotional events that significantly shape market perceptions. Figure 3 illustrates bear market drawdowns (left axis) and the time it takes to reach the market bottom (bottom axis). Red dots represent bear markets linked to a recession; gray dots indicate those not tied to a recession. The median bear market in this time frame lasted 15 months and saw a loss of 34%.
FIGURE 3: DURATION AND MAXIMUM LOSS OF S&P 500 BEAR MARKETS SINCE 1960 (JAN. 1960–DEC. 2023)

Sources: AthenaInvest, S&P Dow Jones Indices LLC, December 2023
Bear markets associated with recessions usually last longer than 16 months. A notable exception is the 2022 bear market, which occurred without a recession—despite widespread media speculation about one during that time.
Successful investing requires patience and a long-term perspective, thinking in terms of years and decades rather than months or quarters. While the volatility and prolonged downturns can be exhausting, managing expectations realistically can help reduce anxiety.
Keep your hands firmly on the data
Investment markets are complex and constantly evolving, making it challenging to analyze them effectively. Relying solely on anecdotes and intuition can lead to poor investment outcomes. As Daniel Kahneman wisely stated, “Trust the numbers, not your gut.”
Relying on intuition and anecdotes is part of a heuristic decision-making process, which shortcuts the thorough analysis that data-rich decisions require. If you catch yourself saying, “I feel …” or “I think …” when making investment recommendations, you’re likely heading down a risky path.
When anecdotal information shapes your investment strategy, you’re relying on a small, often unreliable sample. For example, “I heard it from Anthony, and then from Simone,” doesn’t mean it’s a trend. This is the “law of small numbers” in action.
To avoid these mistakes, build your clients’ investment strategies around a set of objective rules based on robust data. Whether your approach—or that of your third-party investment manager—is fundamental, technical, or behavioral, data should play a central role in guiding decisions. These rules should be based on large, varied data sets and thorough testing. Once established, these rules can largely automate decision-making, with intuition and anecdotal information taking on a much-reduced role.
Advisors should also ensure clients understand the risk-management elements of their investment plan during its development phase—and how they align with their specific risk profile. This leads to a more disciplined investment process with a portfolio designed to be resilient over a wide range of market conditions.
While the goal isn’t to eliminate emotions from the decision-making process—since they can play a crucial role—it’s critical not to let short-term emotional triggers, such as daily market fluctuations, overwhelm disciplined investment strategies.
One of my early favorite comic strips, “Pogo” by Walt Kelly, mixed humor, satire, and political commentary. Its most famous line—“We have met the enemy, and he is us”—rings true for both investors and financial advisors.
Don’t become your own worst enemy when making investment decisions. As Kahneman advised, “Keep your hands firmly on the data when making decisions!”
This article is adapted from several pieces in AthenaInvest’s “Behavioral Education Series for Analysts.”
The opinions expressed in this article are those of the author and the sources cited and do not necessarily represent the views of Proactive Advisor Magazine. This material is presented for educational purposes only.
 C. Thomas Howard, Ph.D., is the founder, CEO, and chief investment officer at AthenaInvest Inc. Dr. Howard is a professor emeritus in the Reiman School of Finance, Daniels College of Business at the University of Denver. Dr. Howard is the author of the book “Behavioral Portfolio Management” and co-author of “Return of the Active Manager.” AthenaInvest applies behavioral finance principles to investment management and also provides advisor coaching and educational resources.
RECENT POSTS


