
It has been a very tough 15 months and easy for investors to get discouraged. We had to dust off an old stock market index that we haven’t had cause to look at since the Great Recession: the Ulcer Index. First developed by Peter Martin and later modified by Steve Shellans of MoniResearch, it’s a volatility indicator that measures downside risk.
While standard deviation and beta are popular volatility measurements, they measure both upside and downside movement. These are valuable measures for sure, but what concerns investors more is downside volatility, and that is what the Ulcer Index focuses on.
The Ulcer Index measures stress on investors. The calculation for the Ulcer Index measures not only the depth of the drawdown but also the length of time the investment is underwater. The longer a strategy or index is underwater, the greater the level of investor anxiety and discomfort.
The higher the Ulcer Index, the greater the emotional stress on the investor. Without going into the math, let’s consider the difference in stress on the investor between two recent bear markets:
- The 2020 bear market, which dropped 34%, lasted just one month and was back to making new money (new highs) within six months.
- The 2022–2023 bear market, which had a maximum market decline of 25%, lasted 10 months from the prior peak to its current bottom. It is still about 17% away from its old high six months into its recovery.
While the drawdown of 2020 was deeper than that of the current bear market, it didn’t last long. Just seven months later, the entire experience was already in the rearview window. Contrast that to the current bear market, which ranks significantly higher in terms of stress. It has now lasted twice as long as the 2020 bear market and recovery, and it still needs a double-digit rally to get back to its old highs. No one knows for sure how long it will take to get back to the old peak or even if the October lows were the final lows.
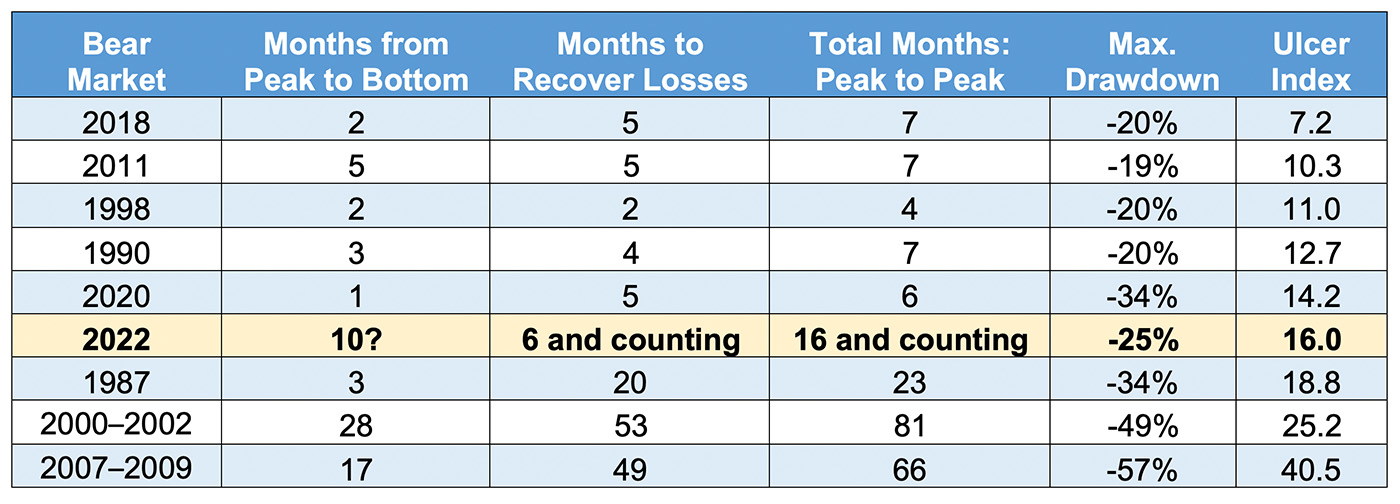
The following table ranks eight bear markets over the past 25 years by “total months from peak to peak.” Looking at the last column, the Ulcer Index, the current bear market ranks as the fourth-worst in 37 years.
TABLE 1: RECENT BEAR MARKETS RANKED BY THE ULCER INDEX
BEAR MARKETS DEFINED BY TIME TO RECOVER PRIOR PEAKS

Sources: FastTrack, STIR Research
The most recent bear market to generate this much anguish (as measured by the Ulcer Index) occurred from October 2007 through March 2009. It lasted 17 months and needed another four-plus years to get back to its old peak in 2013. I don’t believe that the current bear market is going to resemble anything like that, but it should remind us that discouragement leads to poor investment decisions.
During the long recovery times following the major bear markets this century, 2000–2002 and 2007–2009, investor behavior too often was to panic, get discouraged, and abandon equities. They frequently liquidated at the worst possible time, incurring large losses. But more significantly, they missed out on the next big bull market, with potential gains of 100% to 300%.
Currently, the biggest danger to investors is to abandon equities. Instead, we should be focused on finding strategies that will prosper the best in a lengthy rising market. This means strategies that will own the leading asset classes and/or sectors with the ability to add leverage to magnify future gains.
Closing on a note of optimism
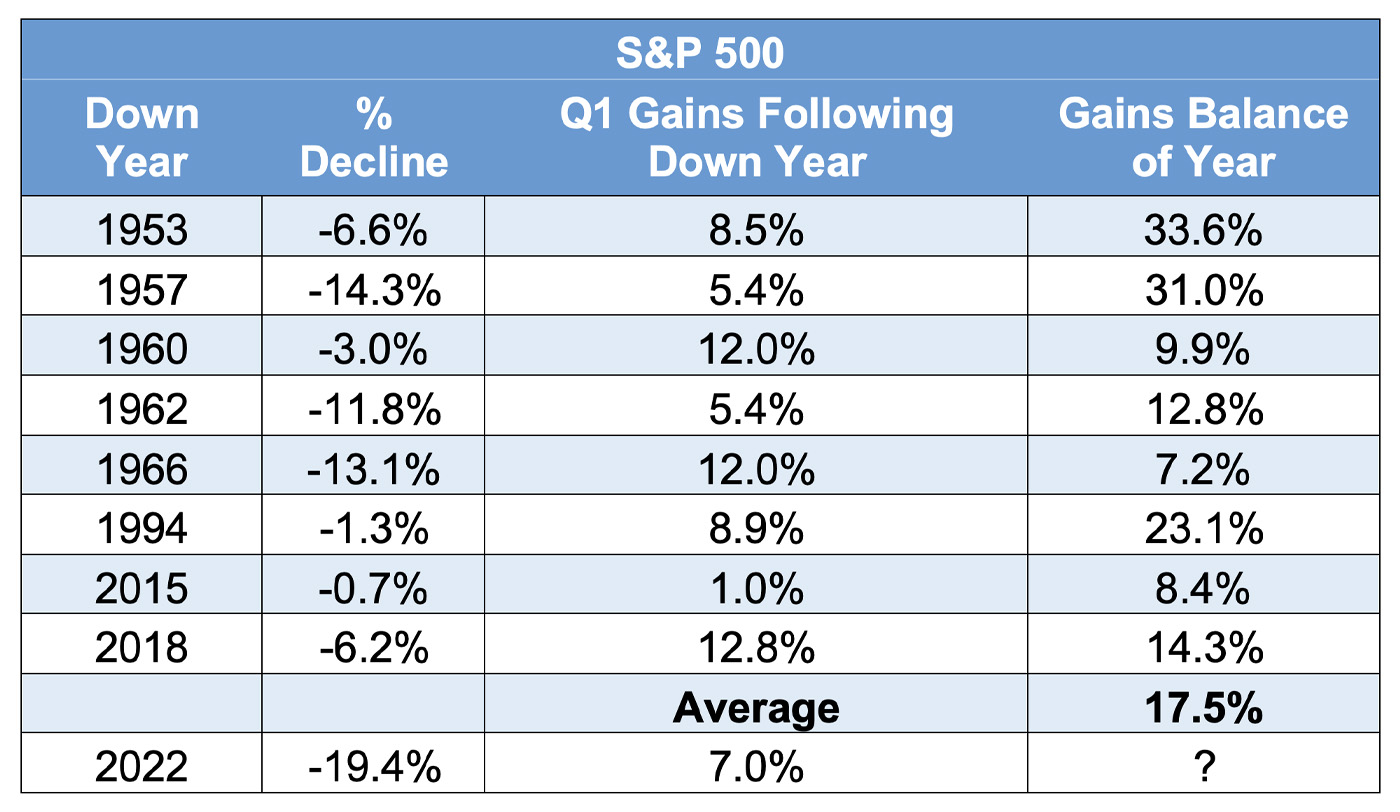
All bear markets end and are followed by new bull market runs. Here is an interesting piece of data that offers some hope: After a down year, if the first quarter of the following year is up, the balance of the year has led to even more gains. That could be the current case. In 2022, the S&P 500 was down 19.4%. This was followed by a gain of 7.0% in Q1 2023.
TABLE 2: MARKET PERFORMANCE WHEN A POSITIVE Q1 FOLLOWS A DOWN YEAR

Sources: 2023 Stock Trader’s Almanac, STIR Research
If the next nine months end up with an average return of 17.5%, that would put the S&P 500 above 4,800 and at new highs.
The opinions expressed in this article are those of the author and do not necessarily represent the views of Proactive Advisor Magazine. These opinions are presented for educational purposes only.
 Marshall Schield is the chief strategist for STIR Research LLC, a publisher of active allocation indexes and asset class/sector research for financial advisors and institutional investors. Mr. Schield has been an active strategist for four decades and his accomplishments have achieved national recognition from a variety of sources, including Barron's and Lipper Analytical Services. stirresearch.com
