The surprising link between taxes and the U.S. dollar
The surprising link between taxes and the U.S. dollar

Every U.S. president and Treasury secretary claims to favor a strong dollar, although they usually secretly wish for a weaker dollar to make U.S. exports more attractive. But I bet none of them have ever been aware of the relationship between taxes and the dollar.
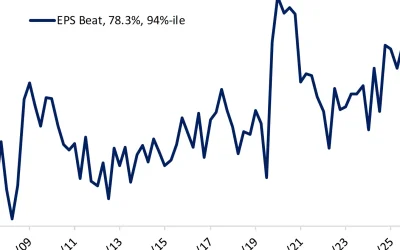
This week’s chart (below) illustrates that relationship. The upper plot in black shows the U.S. Dollar Index, a basket of major world currencies dominated by the euro, measured against the dollar. Most of you are already familiar with that. The lower plot in green shows total federal tax receipts as a percentage of GDP, shifted forward by eight months. This adjustment reveals that the value of the dollar tends to follow the path of tax receipts, with a lag time of about eight months.
U.S. DOLLAR INDEX VS. FEDERAL TAX RECEIPTS
12-month trailing total as a % of GDP, adjusted forward eight months

Source: McClellan Financial Publications
![]() Related Article: The two-year Treasury-note yield calls for a Fed rate cut
Related Article: The two-year Treasury-note yield calls for a Fed rate cut
What that means for the immediate future is that the value of the dollar should be expected to rise over at least the next eight months, based on total government revenues having risen in recent months. Part of that is the additional $30 billion a month coming in from tariffs, and another big part is from higher capital gains taxes, thanks to the rising stock market.
The big problem with this forecasting model is that about every 10 to 12 years we see a big inversion between the two plots before the relationship rights itself again. I note that it is every 10 to 12 years, but we only have good monthly data on tax receipts back to 1980. Before then, the data are only annual, so it is too hard to extend this chart back further than I show here. If the inversion really occurs every 10 to 12 years, then the next event would be due in 2030–2032. Or it might just be random; we don’t yet have enough years of data to make that determination.
Why would this relationship work? That is an interesting question, but not an essential one. We can see that it has worked (imperfectly) for decades, and we can acknowledge that even if we cannot explain the “why.”
But we always want to know the why, so here is my theory.
It used to be that “a dollar” had a defined value, meaning that if you had $20.67, you could get one ounce of gold. President Franklin D. Roosevelt then changed that to $32, but it was still a defined value. Those days are gone, and the dollar does not have a specified value. It does have lots of uses, however, some straightforward and others less so.
The most well-defined use case for a dollar is that you can for sure pay your taxes with it. The federal government will always accept dollars as payment for its taxes. Others may be more or less willing over time to accept dollars in trade, but Uncle Sam always accepts dollars. So as tax collections rise, the demand for dollars to pay those taxes rises. And if the demand for something rises, its price usually also rises.
I concede that is a weak-sounding causal explanation, and it does not explain the episodes of this relationship inverting, but that’s the best I have. And I will reiterate that we do not necessarily need to know the cause of a phenomenon to accept its validity.
This is an edited version of an article that first appeared at McClellan Financial Publications on Sept. 11, 2025.
The opinions expressed in this article are those of the author and the sources cited and do not necessarily represent the views of Proactive Advisor Magazine. This material is presented for educational purposes only.
 Tom McClellan is the editor of The McClellan Market Report newsletter and its companion, Daily Edition. He started that publication in 1995 with his father Sherman McClellan, the co-creator of the McClellan Oscillator, and Tom still has the privilege of working with his father. Tom is a 1982 graduate of West Point, and served 11 years as an Army helicopter pilot before moving to his current career. Tom was named by Timer Digest as the #1 Long-Term Stock Market Timer for both 2011 and 2012. mcoscillator.com
RECENT POSTS