


It has been said that this is “the most hated bull market in history.”
Many investors and analysts have had suspicions about the rally since day one. And after years of rallying, some are questioning if the secular bull market is over, even though they barely embraced the idea that we were ever in one.
From a historical perspective, this emotional behavior is normal. Secular bear markets end with investors capitulating, fearful, and depressed. Secular bulls then go through three lengthy emotional stages: (1) denial and doubt, (2) acceptance, and (3) euphoria. In my opinion, most investors are now in the “acceptance” stage.
Today’s secular bull is no different from the previous two. At the eight-year mark, the 2011–2019 secular bull has gained 174%, not far behind the 196% gain of the 1949–1968 secular bull or the 206% gain of the 1982–2000 run at a similar point in time. Both of those previous bull markets went on to impressive further gains, as seen in the following figure at the right side of the chart.
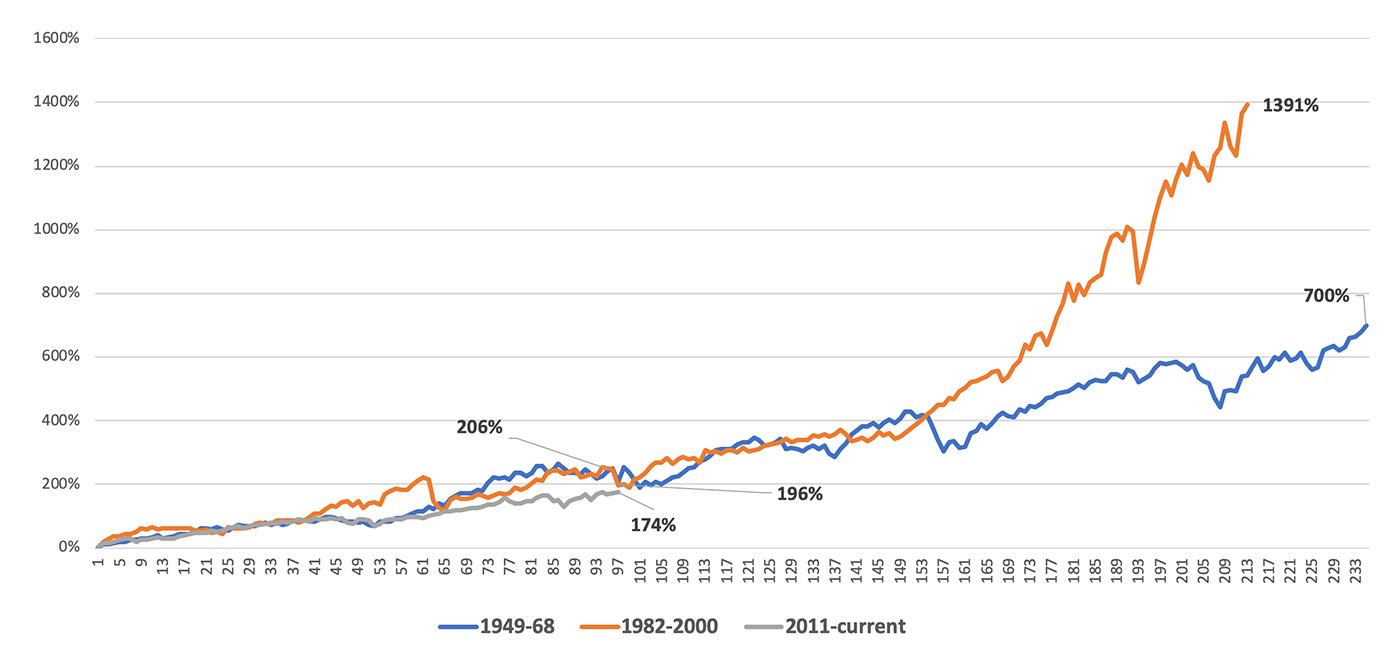
Source: STIR Research, market data.
I am reminded somewhat of 1990. Investors were at the eight-year mark of the 1982–2000 bull and still fearful after the “Crash of ‘87” and the cyclical bear market of 1990. For many years during that period, it was rare for equity purchases to outpace new bond buying.
From 1991 to 1996, investors moved into acceptance, becoming more confident in buying equities. Today, with yields at record lows, any bounce in interest rates will create large bond losses. Investors will begin to accept that equities have a brighter future.
“If I had a choice today for a 10-year purchase of a 10-year bond at whatever it is … or buying the S&P 500 and holding it for 10 years, I’d buy the S&P in a second.”
Stocks are cheap when compared to bonds: The S&P 500 GAAP earnings yield (inverse of the price-earnings, or P/E, ratio) is 4.7% versus the 1.7% yield on the 10-year Treasury, putting stocks in the cheapest quintile versus T-notes for the past 80 years. Prior secular bull markets have ended in euphoria, where the earnings yield was less than the Treasury yield. In 1968, the earnings yield was 5.5% versus 5.8% for the Treasury; in 2000, the earnings yield was about half of the Treasury yield, 3.5% versus 6.4%. Also, consider the fact that the 10-year Treasury yields 1.7% versus an annualized return of 13.3% from stocks in the current secular bull.
Part of the overall gain in secular bull markets comes from the expansion of the P/E ratio. In the 1949–1968 run, the P/E ratio rose 200%, from 6 to 19; in the last secular bull of 1982–2000, the gain was over 300%, moving from 7 to 30. Since 2011, the P/E ratio has expanded by just 75%, moving from lows around 12 to 21 currently. The last stage of secular bulls involves investors becoming euphoric (“This is never going to end!”), a heightened interest in day-trading and speculative stocks, and ads showing successful investors buying their own islands! That attitude is what sends P/E ratios soaring. The market is far from being euphoric and is instead in the middle stage of acceptance.
The market is close to ending a 21-month period of sometimes very punishing sideways action, punctuated by two painful intermediate corrections. The Q4 2018 correction qualified as a cyclical bear market when the Russell 1000, Russell 2000, and NASDAQ posted losses of over 20%.
This lengthy sideways move, with a series of slightly new highs from 2,900 to 3,000, has rung out many market excesses and is setting the stage for double-digit gains.
It is extremely valuable to know the type of macro-environment the market is in—and whether investors are fighting headwinds or enjoying the benefits of a strong tailwind.
Enjoy the tailwinds! This secular equity bull has many years to go with a lot more gains ready to be captured!
 Marshall Schield is the chief strategist for STIR Research LLC, a publisher of active allocation indexes and asset class/sector research for financial advisors and institutional investors. Mr. Schield has been an active strategist for four decades and his accomplishments have achieved national recognition from a variety of sources, including Barron's and Lipper Analytical Services. stirresearch.com