
Putting pullbacks in perspective
Putting pullbacks in perspective

Market pullbacks can be unnerving. That is why investors should make a plan with their financial advisors that addresses pullbacks and is informed by historical perspective, not emotion.
Editor’s note: A revised and updated version of this article can be found here.
We can gain important perspective on market pullbacks by considering post-World War II declines in the S&P 500 Index. The majority of declines fall within the 5%–10% range with an average recovery time of approximately one month, while declines between 10%–20% have an average recovery period of approximately four months.
Pullbacks within these ranges are not uncommon, occurring frequently during the normal market cycle. While they can be emotionally unnerving, they will not generally undermine a well-diversified portfolio and are not necessarily signals for panic. Even more severe pullbacks of 20%–40% registered an average recovery period of only 15 months.
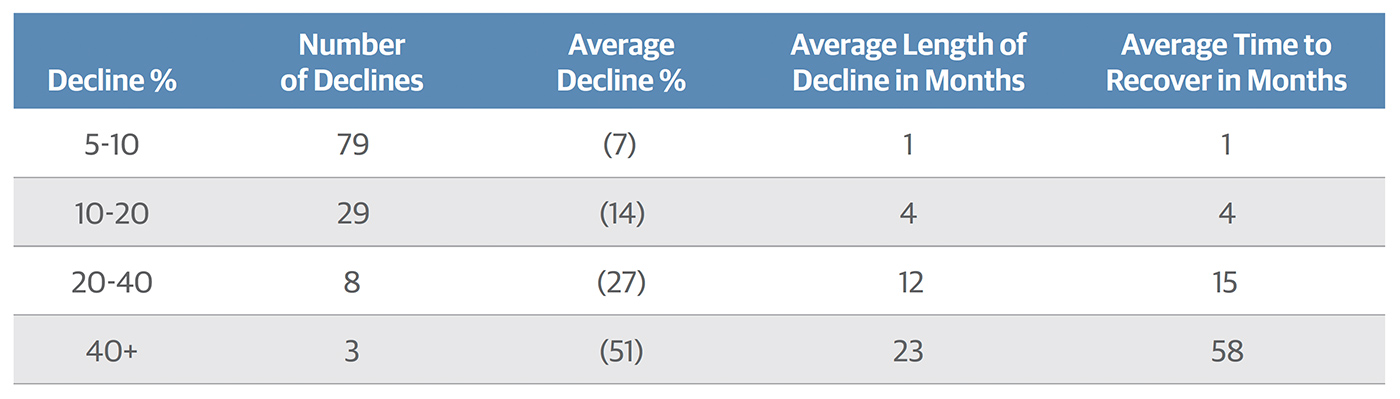
Source: Data as of 6/30/2019. Copyright 2019 Ned Davis Research Inc. Further distribution prohibited without prior permission. All rights reserved.
In contrast, pullbacks of 40% or more, while occurring much less frequently, post an average recovery time of 58 months and can potentially compromise an investor’s financial plan. Pullbacks above 20% (including all pullbacks above 40%), which have registered the longest recovery periods, have been associated with economic recessions.
When evaluating a market pullback, the probability of a recession is a key insight to consider when determining whether to reduce equity exposure. While recessions are readily identifiable in hindsight, prospectively they can be difficult to spot. This makes access to reliable market analysis all the more important when determining the probability of a recession.

In this section, Guggenheim Investments provides its view of the current market environment as of August 2019.
U.S. economic growth slowed to 2.1% annualized in the second quarter of 2019 from 3.1% in the first quarter. Personal consumption expenditures rebounded sharply, as expected, while government spending contributed an outsized 0.9 percentage point to growth, the most since mid-2009. However, negative contributions were seen from housing, business capital expenditures, inventory investment, and net exports. Looking ahead, we expect the economy to grow at around a 2.0% pace in the third quarter.
The Q2 gross domestic product (GDP) release also featured annual revisions to the five prior years of data, which showed that growth peaked in year-over-year terms in Q2 2018, earlier than previously thought. An upwardly revised personal savings rate gives consumption room to run, while downwardly revised and shrinking corporate profits will continue to pressure investment spending and could begin to weigh more heavily on hiring.
With growth in the first half of the year coming in somewhat above potential, the labor market continued to strengthen, albeit at a slower pace than the year before. Net monthly payroll gains averaged 172,000 in the first half of 2019, down from 235,000 in the first half of 2018. This was enough to push the unemployment rate down by 0.2 percentage points to 3.7%. While the labor market remains strong, we believe the sharper slowdown in aggregate hours worked—a component of our U.S. Recession Dashboard—foreshadows a deterioration in labor market conditions in 2020.
After a weak start to the year, core inflation picked up in the second quarter but remained below the Federal Reserve’s (Fed’s) target at 1.8% annualized. We expect inflation to firm a bit further in the second half of 2019. The Fed is also closely watching inflation expectations, which currently sit below levels the Fed would like to see.
Although the U.S. economy is in good shape overall, on July 31 the Fed announced its first rate cut since 2008 amid growing downside risks to policymakers’ baseline growth and inflation forecasts. Key among these are slowing global growth, the threat of additional U.S.-China tariffs, and a possible hard Brexit, the odds of which have increased with the ascendance of Boris Johnson as the U.K. prime minister. While a possible U.S. fiscal contraction in 2020 was averted by the recently signed budget deal, we expect two more Fed rate cuts in 2019 as Fed Chairman Jerome Powell seeks to sustain the expansion. In our view, this could serve to embolden the White House to impose new tariffs on China and Europe later this year, which would, in turn, further cloud the outlook for global growth.
The business cycle is one of the most important drivers of investment performance. It is therefore critical for investors to have a well-informed view on the business cycle so portfolio allocations can be adjusted accordingly. At this stage, with the current U.S. expansion showing signs of aging, our focus is on projecting the timing of the next downturn.
Guggenheim has developed several tools to guide this effort. The last several expansions have shown similar patterns leading up to a recession. We have created a Recession Dashboard of six indicators that have exhibited consistent cyclical behavior, and that can be tracked relatively well in real time. These six indicators include a measure of the unemployment gap, the stance of monetary policy, the shape of the yield curve, the Leading Economic Index, changes in aggregate weekly hours worked, and changes in consumer spending. In addition to our dashboard of recession indicators, we have also developed an integrated Recession Probability Model that attempts to predict the probability of a recession over six-, 12-, and 24-month horizons. Our methodology is explained in greater detail on our Forecasting the Next Recession page on GuggenheimInvestments.com.
Taken together, our Recession Dashboard and our proprietary Recession Probability Model point to the next recession beginning as early as the first half of 2020.
Naturally, there are substantial risks that our recession date could be too early or too late. Nevertheless, we believe that successful investing requires a road map, as with any other endeavor. Our investment team uses this road map to help guide our portfolio management decisions in order to seek superior risk-adjusted performance over time and across cycles.
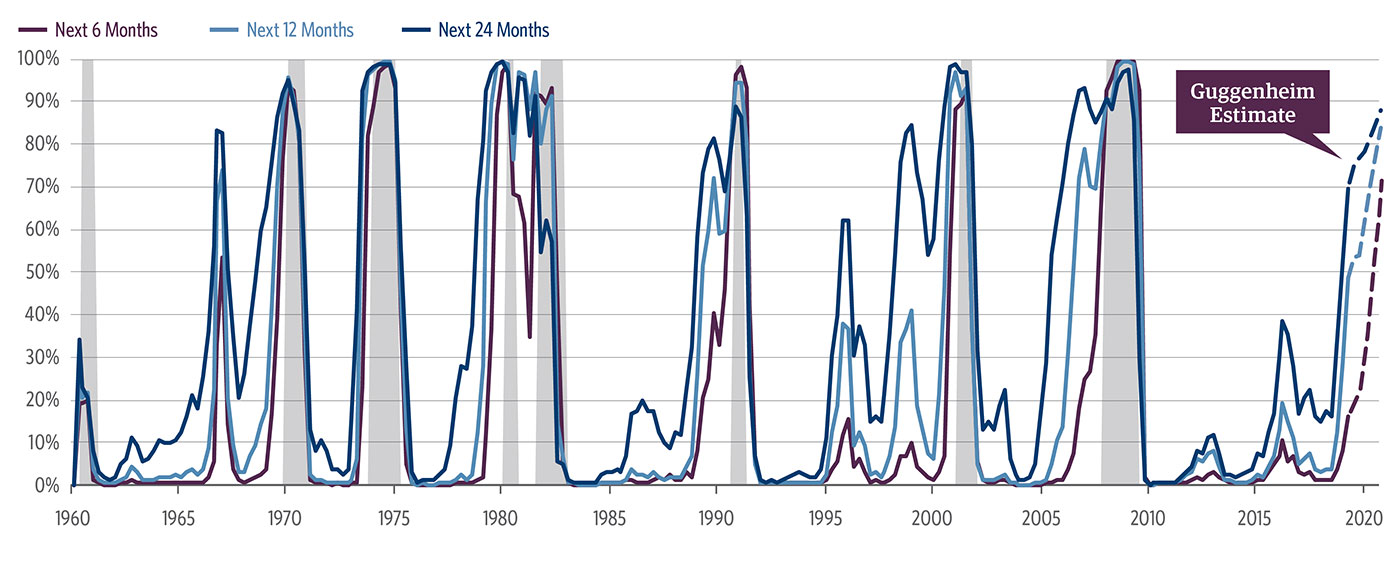
Note: Hypothetical illustration. The Recession Probability Model is a new model with no prior history of forecasting recessions. Its future accuracy cannot be guaranteed. Actual results may vary significantly from the results shown. This illustration is not representative of any Guggenheim Investments product.
Source: Haver Analytics, Bloomberg, Guggenheim Investments. Data as of 6/30/2019. Shaded areas represent periods of recession.
While there is a relationship between the days since the end of the last correction and the magnitude of pullback, as shown in Figure 2, the majority of pullbacks during nonrecessionary periods registered declines under 20%.
As we discussed earlier, pullbacks falling within the 5%–20% range historically experience recovery periods of one to four months. These are not periods typically associated with severe economic deterioration, and they do not necessarily represent a signal to reduce equity exposure. As of the date of this analysis (Aug. 1, 2019), there had been 220 days since a nonrecessionary pullback of greater than 10%.
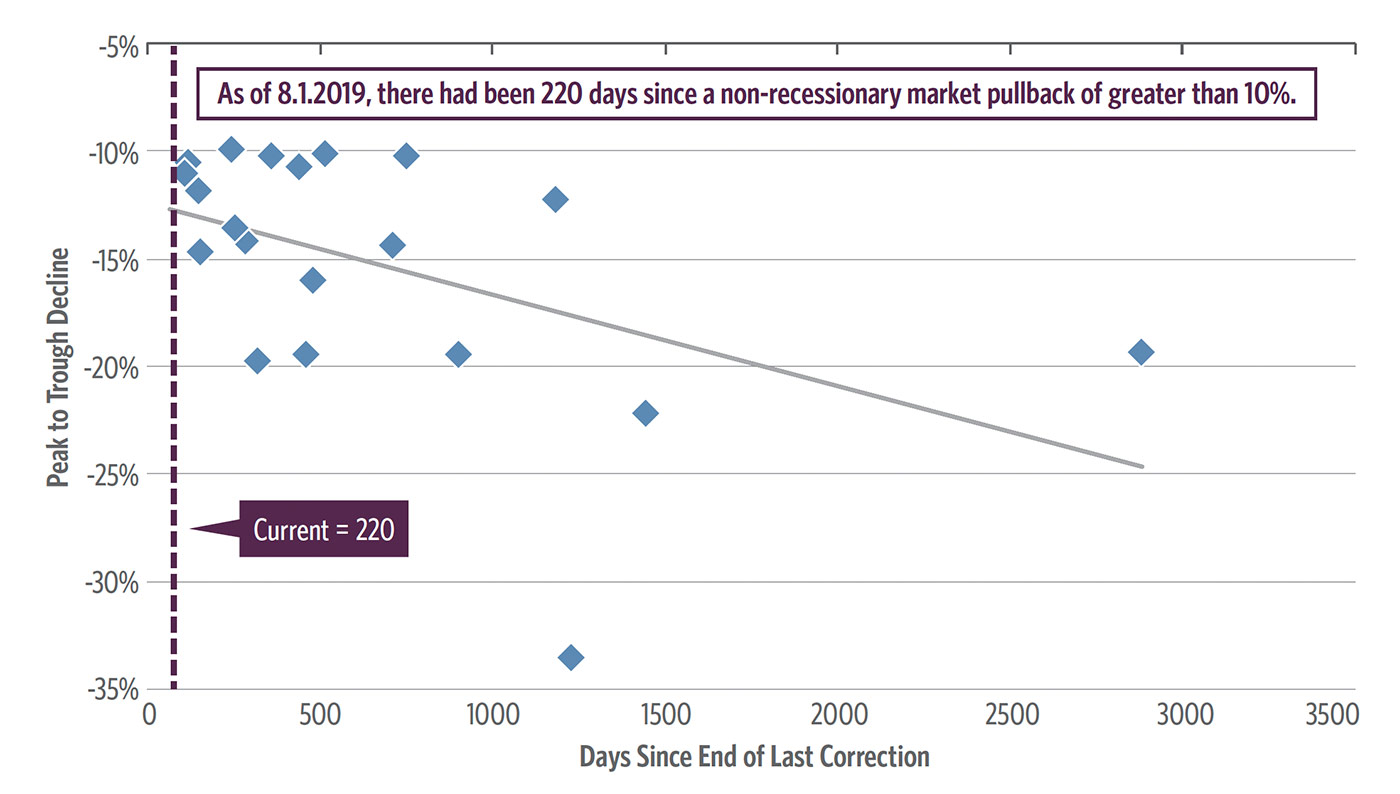
Source: Guggenheim Investments. Data as of 8/1/2019.
Pullbacks are often not a time to panic and should rather be used as a reason to analyze and assess. Under certain circumstances, it may even be the case that a pullback represents an attractive buying opportunity for certain portfolios. The benefit of gaining reliable market and economic perspective is essential in preparing for market pullbacks. Rather than act on emotion, it’s important to put these events in context to determine what they mean.
Working with a financial advisor, investors may then better assess any potential impact on their portfolios and implement a proper course of action, if any is necessary, that is in line with their investment objectives.
The opinions expressed in this article are those of the author and do not necessarily represent the views of Proactive Advisor Magazine.
This article is based on commentary published in the summer of 2019 from Guggenheim Investments’ “Crucial Conversations” series.
Investing involves risk, including the possible loss of principal.
This material is distributed or presented for informational or educational purposes only and should not be considered a recommendation of any particular security, strategy, or investment product, or as investing advice of any kind. This material is not provided in a fiduciary capacity, may not be relied upon for or in connection with the making of investment decisions, and does not constitute a solicitation of an offer to buy or sell securities. The content contained herein is not intended to be and should not be construed as legal or tax advice and/or a legal opinion. Always consult a financial, tax and/or legal professional regarding your specific situation.
This material contains opinions of the author or speaker, but not necessarily those of Guggenheim Partners LLC or its subsidiaries. The opinions contained herein are subject to change without notice. Forward-looking statements, estimates, and certain information contained herein are based upon proprietary and nonproprietary research and other sources. Information contained herein has been obtained from sources believed to be reliable, but are not assured as to accuracy. Past performance is not indicative of future results. There is neither representation nor warranty as to the current accuracy of, nor liability for, decisions based on such information. No part of this material may be reproduced or referred to in any form, without express written permission of Guggenheim Partners LLC.
©2019 Guggenheim Partners LLC. Guggenheim Investments represents the investment management business of Guggenheim Partners LLC. Securities offered through Guggenheim Funds Distributors LLC.
S&P 500 is a registered trademark of Standard & Poor’s Financial Services LLC (“S&P”) and is licensed to S&P Dow Jones Indices LLC.
For Table 1: Copyright 2019 Ned Davis Research Inc. Further distribution prohibited without prior permission. All rights reserved. See NDR disclaimer at https://www.ndr.com/copyright.html. For data vendor disclaimers refer to www.ndr.com/vendorinfo.
Guggenheim Investments is the global asset management and investment advisory division of Guggenheim Partners and manages assets across fixed-income, equity, and alternative strategies. Guggenheim Investments focuses on the return and risk needs of insurance companies, corporate and public pension funds, sovereign wealth funds, endowments and foundations, consultants, wealth managers, and high-net-worth investors. They offer frequent market commentary and white papers for their clients and the investment community. www.guggenheiminvestments.com