Putting pullbacks in perspective
Putting pullbacks in perspective

Market pullbacks can be unnerving. That is why investors should make a plan with their financial advisors that addresses pullbacks and is informed by historical perspective, not emotion.
Pullbacks & bouncebacks
We can gain important perspective on market pullbacks by considering post-World War II declines in the S&P 500 Index. The majority of declines fall within the 5%-10% range with an average recovery time of approximately one month, while declines between 10%-20% have an average recovery period of approximately four months. Pullbacks within these ranges are not uncommon, occurring frequently during the normal market cycle. While they can be emotionally unnerving, they will not generally undermine a well-diversified portfolio and are not necessarily signals for panic. Even more severe pullbacks of 20%-40% have registered an average recovery period of only 13.8 months.
TABLE 1: THE DEEPER THE STOCK MARKET DECLINE, THE LONGER THE RECOVERY
Declines in the S&P 500 (since 12/31/1945). Historically, the majority of market pullbacks have registered declines under 20%.

Source: Guggenheim Investments. Data as of 5/16/2022.
In contrast, pullbacks of 40% or more, while occurring much less frequently, post an average recovery time of approximately 58 months and can potentially compromise an investor’s financial plan. Pullbacks above 20% (including all pullbacks above 40%), which have registered the longest recovery periods, have been associated with economic recessions. When evaluating a market pullback, the probability of a recession is a key insight to consider when determining whether or not to reduce equity exposure. While recessions are readily identifiable in hindsight, prospectively they can be difficult to spot. This makes access to reliable market analysis all the more important when determining the probability of a recession.
Where are we now?
Despite Russia’s attack on Ukraine, COVID-19 shutdowns in China, and the commencement of rate hikes by the Federal Reserve (Fed), the U.S. economy remains on a strong footing. The 1.4% contraction in Q1 real GDP was weaker than consensus expectations. However, this headline number substantially overstates the slowdown in economic growth, as GDP growth was weighed down by large negative contributions from net exports and inventories, which tend to be volatile and are not a good guide to underlying growth. If we just look at consumption and fixed investment, we see growth of 3.7% annualized, a strong pace that is actually faster than the prior two quarters. So the implications of the GDP report are that the economy is continuing to overheat, despite the negative headline number. Economic strength continues to embolden the Fed to move aggressively as it attempts to rein in inflation by raising interest rates and shrinking its balance sheet. The Fed is increasingly concerned about inflation and will act aggressively to get monetary policy to a more appropriate stance. The Fed’s strategy at this point is to get rates back to a neutral level as fast as possible, and then see how far into restrictive territory it needs to go based on how the economic and financial market data evolve.
The U.S. economy proved resilient against the coronavirus, but policy is shifting
The business cycle is one of the most important drivers of investment performance. It is therefore critical for investors to have a well-informed view on the business cycle so portfolio allocations can be adjusted accordingly. After the economy bounced back from a deep but quick recession, our focus has pivoted to understanding how long and how durable the recovery will be, particularly with the Fed beginning to remove accommodation.
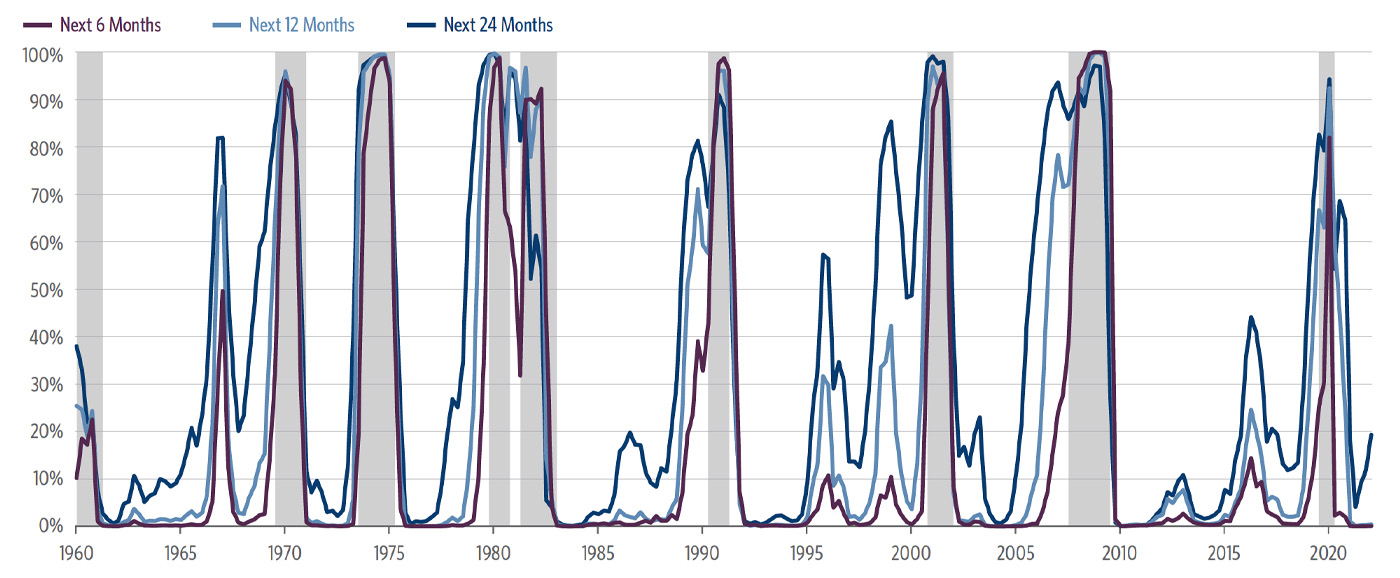
Guggenheim has developed several tools to guide this effort. Our Recession Probability Model predicts the probability of a recession over six-, 12-, and 24-month horizons. As of the first quarter, the model points to low risk of recession in 2022, with underlying aggregate demand seeing strong momentum, a continued recovery in service sector spending, and consumers drawing on a sizable stock of excess savings from unspent fiscal stimulus. At longer horizons, the model sees rising risk of recession in late 2023 or 2024, with this recession risk likely to increase as the Fed aggressively tightens policy in attempt to cool demand and bring down inflation. Naturally, there are substantial risks when forecasting the business cycle. Nevertheless, we believe that successful investing requires a road map, as with any other endeavor. Our investment team uses this road map to help guide our portfolio management decisions in order to seek superior risk-adjusted performance over time and across cycles.
FIGURE 1: RECESSION PROBABILITY MODEL

Hypothetical illustration.1 The Recession Probability Model was established in 2017 with no prior history of forecasting recessions. Its future accuracy cannot be guaranteed. Actual results may vary significantly from the results shown. This illustration is not representative of any Guggenheim Investments product.
Sources: Haver Analytics, Guggenheim Investments. Data as of 3/31/2022. Shaded areas represent periods of recession.
Interval since last (10%+) pullback
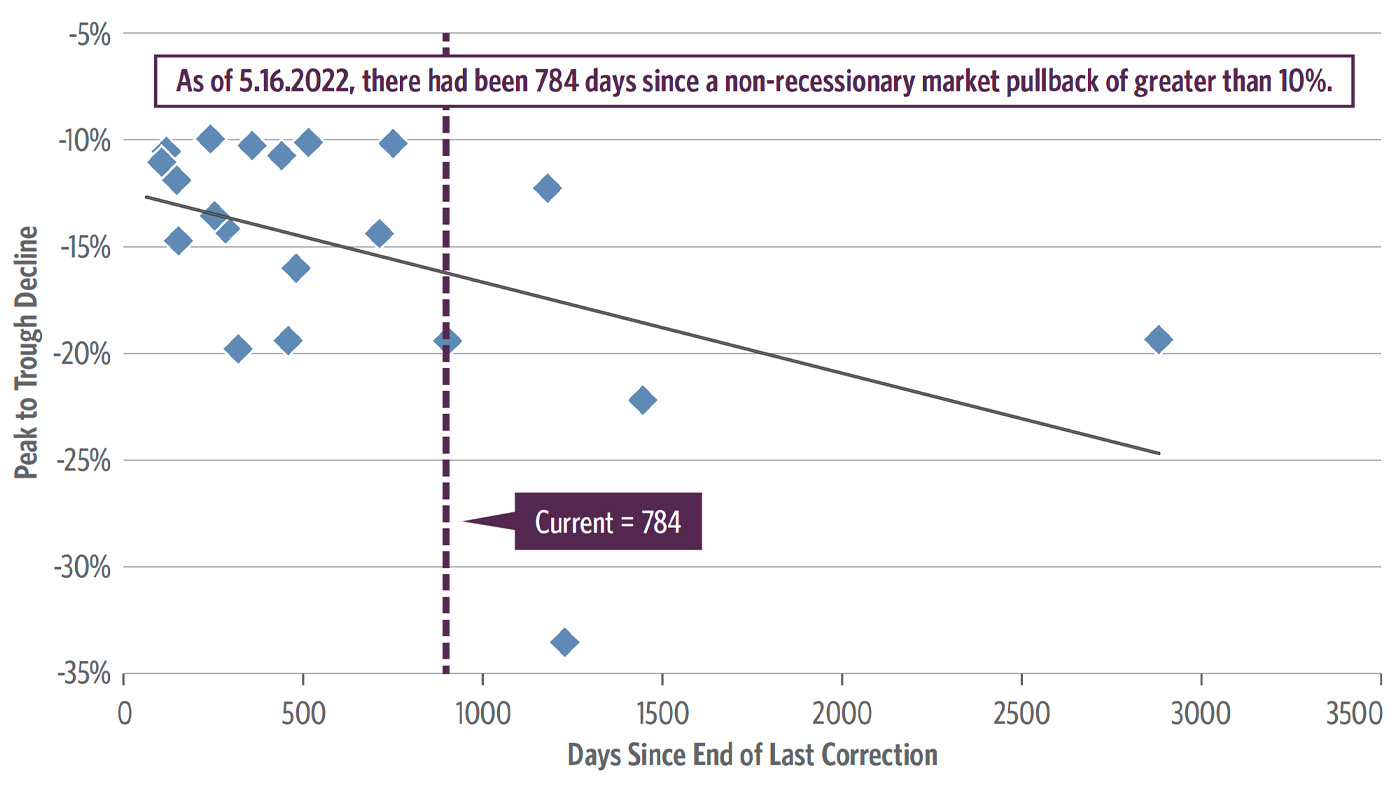
While there is a relationship between the days since the end of the last correction and the magnitude of pullback, as shown in Figure 2, the majority of pullbacks during nonrecessionary periods registered declines under 20%. As we discussed earlier, pullbacks falling within the 5%–20% range historically experience recovery periods of one to four months. These are not periods typically associated with severe economic deterioration, and do not necessarily represent a signal to reduce equity exposure. As of the date of this analysis (May 16, 2022), the ongoing pullback is occurring 784 days after the last decline of greater than 10%.
FIGURE 2: NONRECESSION S&P 500 CORRECTIONS (>10% DECLINE) SINCE 1962

Source: Guggenheim Investments. Data as of 5/16/2022.
Putting pullbacks in perspective
Pullbacks are often not a time to panic and should rather be used as a reason to analyze and assess. Under certain circumstances, it may even be the case that a pullback represents an attractive buying opportunity for certain portfolios. The benefit of gaining reliable market and economic perspective is essential in preparing for market pullbacks. Rather than act on emotion, it’s important to put these events in context to determine what they mean. Working with a financial advisor, investors may then better assess any potential impact on their portfolios and implement a proper course of action, if any is necessary, that is in line with their investment objectives.
The opinions expressed in this article are those of the author and do not necessarily represent the views of Proactive Advisor Magazine. These opinions are presented for educational purposes only.
This article is based on commentary published in the spring of 2022 from Guggenheim Investments’ “Crucial Conversations” series.
Investing involves risk, including the possible loss of principal.
This material is distributed or presented for informational or educational purposes only and should not be considered a recommendation of any particular security, strategy, or investment product, or as investing advice of any kind. This material is not provided in a fiduciary capacity, may not be relied upon for or in connection with the making of investment decisions, and does not constitute a solicitation of an offer to buy or sell securities. The content contained herein is not intended to be and should not be construed as legal or tax advice and/or a legal opinion. Always consult a financial, tax, and/or legal professional regarding your specific situation.
This material contains opinions of the author or speaker, but not necessarily those of Guggenheim Partners, LLC or its subsidiaries. The opinions contained herein are subject to change without notice. Forward-looking statements, estimates, and certain information contained herein are based upon proprietary and non-proprietary research and other sources. Information contained herein has been obtained from sources believed to be reliable, but are not assured as to accuracy. Past performance is not indicative of future results. There is neither representation nor warranty as to the current accuracy of, nor liability for, decisions based on such information. No part of this material may be reproduced or referred to in any form, without express written permission of Guggenheim Partners, LLC. © 2022 Guggenheim Partners, LLC. Guggenheim Investments represents the investment management business of Guggenheim Partners, LLC. Securities offered through Guggenheim Funds Distributors, LLC.
Not FDIC insured. Not bank guaranteed. May lose value.
S&P 500 is a registered trademark of Standard & Poor’s Financial Services LLC (“S&P”) and is licensed to S&P Dow Jones Indices LLC.
1For Figure 1: Guggenheim’s Recession Probability Model attempts to predict the probability of a recession over six-, 12-, and 24-month horizons. Guggenheim developed the model using the unemployment gap, the stance of monetary policy, the yield curve, and the Conference Board Leading Economic Index (LEI), as well as the share of cyclical sectors of the economy (durable goods consumption, housing, and business investment in equipment and intellectual property) as a percent of GDP.
New this week:
Guggenheim Investments is the global asset management and investment advisory division of Guggenheim Partners and manages assets across fixed-income, equity, and alternative strategies. Guggenheim Investments focuses on the return and risk needs of insurance companies, corporate and public pension funds, sovereign wealth funds, endowments and foundations, consultants, wealth managers, and high-net-worth investors. They offer frequent market commentary and white papers for their clients and the investment community. www.guggenheiminvestments.com
