Lowest level for the put/call ratio since 2021
Lowest level for the put/call ratio since 2021

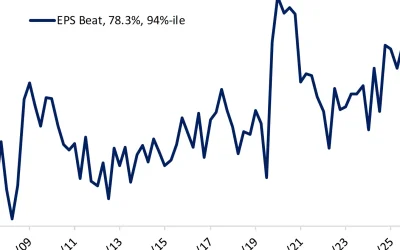
Persistently low readings lately for the Cboe Put/Call Volume Ratio (for all products) have pulled down the 5-day moving average (MA) to its lowest reading since the top of the last bull market in December 2021. Such readings are pretty reliably associated with meaningful tops for stock prices.
That is, unless the Fed has its thumb on the scale.
Right after the federal and state governments in the U.S. shut down everything due to COVID in 2020, the Federal Reserve responded by initiating its fourth round of quantitative easing (QE4), which lasted from March 2020 to the end of 2021.
At its height, QE4 saw the Fed pumping as much as $1 trillion per month into the banking system. That had the predictable effect of pushing up stock prices. The actual economy could not digest being fed QE with a firehose, and all of that money went looking for a mission. During that Fed-fueled uptrend, we saw much lower readings for the 5-day MA of the put/call ratio shown in Figure 1, and they did not matter. That is a testament to the power of the Fed.
Now we have a really low reading but no QE. In fact, the Fed is still trying to dismantle the stimulus it provided through QE4 by reducing its holdings of the Treasury and mortgage debt that it bought in 2020–2021. So we do not have that same condition now to mess with what should be a perfectly good indication of trader overconfidence.
FIGURE 1: LOWEST READING FOR PUT/CALL RATIO SINCE 2021

Sources: Cboe, McClellan Financial Publications. Data as of July 13, 2023.
The put/call ratio was first discovered by the late Martin Zweig. In his book, “Winning on Wall Street,” Zweig described seeing the data published each day in The Wall Street Journal for the numbers of puts and calls traded, and he wondered if it meant anything. After gathering the data, he quickly realized the value of these data as a sentiment indication. When traders are optimistic, they favor trading call options, which (hopefully) increase in value as stock prices go up. When they are pessimistic, they trade more put options, betting on lower prices. That is the magic of examining these data. It is not a sentiment survey, where people say what they think; it is a measure of how people are making bets with their actual money.
Middling values really do not tell us much. It is only when the put/call ratio gets to an extreme that it becomes really useful. But what constitutes an “extreme”? For that, we have to put the data on a chart and see what types of values have mattered in the past. The upper and lower threshold lines in the chart above are arbitrarily drawn, and one could reasonably argue that either of them ought to be moved up or down a little bit. It is also worth noting that the reaching of an extreme level for this (or any) indicator is not a “signal,” but rather it represents a “condition.” The market does not necessarily have to react immediately just because you or I may notice an extended condition.
But readings like those we are seeing this week in the put/call ratio’s 5-day MA [through July 13] do tend to matter eventually, as long as the Fed does not get in the way.
![]() Related Article: Higher rates creating indigestion
Related Article: Higher rates creating indigestion
The opinions expressed in this article are those of the author and the sources cited and do not necessarily represent the views of Proactive Advisor Magazine. This material is presented for educational purposes only.
This is an edited version of an article that first appeared at McClellan Financial Publications on July 13, 2023.
 Tom McClellan is the editor of The McClellan Market Report newsletter and its companion, Daily Edition. He started that publication in 1995 with his father Sherman McClellan, the co-creator of the McClellan Oscillator, and Tom still has the privilege of working with his father. Tom is a 1982 graduate of West Point, and served 11 years as an Army helicopter pilot before moving to his current career. Tom was named by Timer Digest as the #1 Long-Term Stock Market Timer for both 2011 and 2012. mcoscillator.com
RECENT POSTS