Editor’s note: Proactive Advisor Magazine thanks First Trust for permission to republish edited versions of two commentaries related to trends in recent inflation data. Brian Wesbury, chief economist at First Trust Advisors LP, and Bob Carey, chief market strategist, authored these posts on Aug. 10, 2023.
Highlights of the July consumer price index (CPI) report
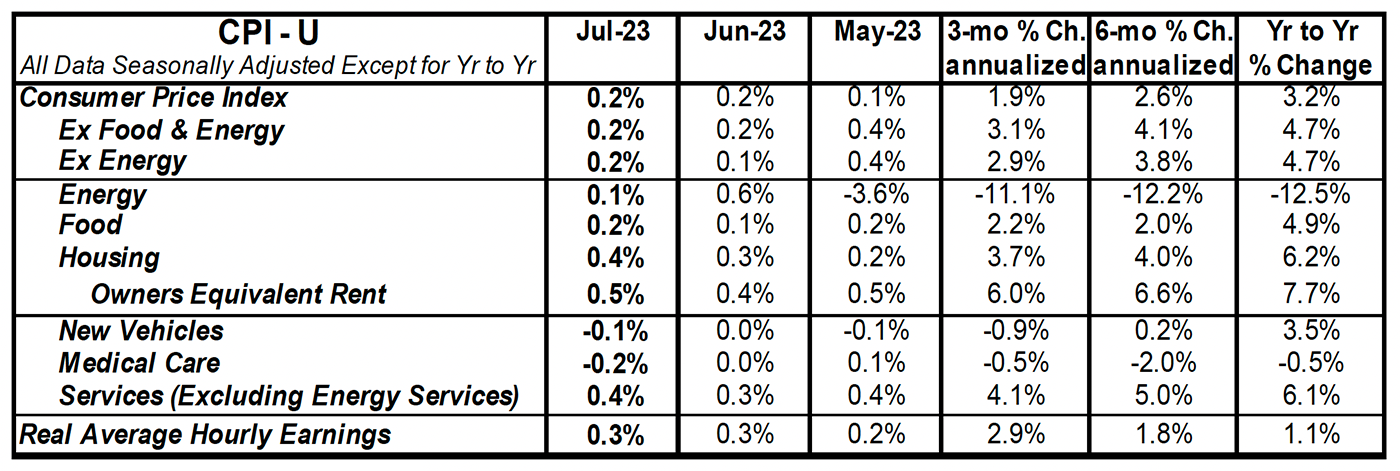
- The consumer price index (CPI) rose 0.2% in July, matching consensus expectations. The CPI is up 3.2% from a year ago.
- Food prices rose 0.2% in July, while energy prices rose 0.1%. The “core” CPI, which excludes food and energy, rose 0.2% in July, also matching consensus expectations. Core prices are up 4.7% versus a year ago.
- Real average hourly earnings—the cash earnings of all workers, adjusted for inflation—increased 0.3% in July and are up 1.1% in the past year. Real average weekly earnings are up 0.2% in the past year.

Sources: Bureau of Labor Statistics, Haver Analytics
Implications of the CPI report
More progress was made against inflation in July. But don’t get overly excited.
The recent surge in energy prices came too late in July to affect the monthly numbers. It will hit in August and could be enough to reverse the decline in year-over-year comparisons.
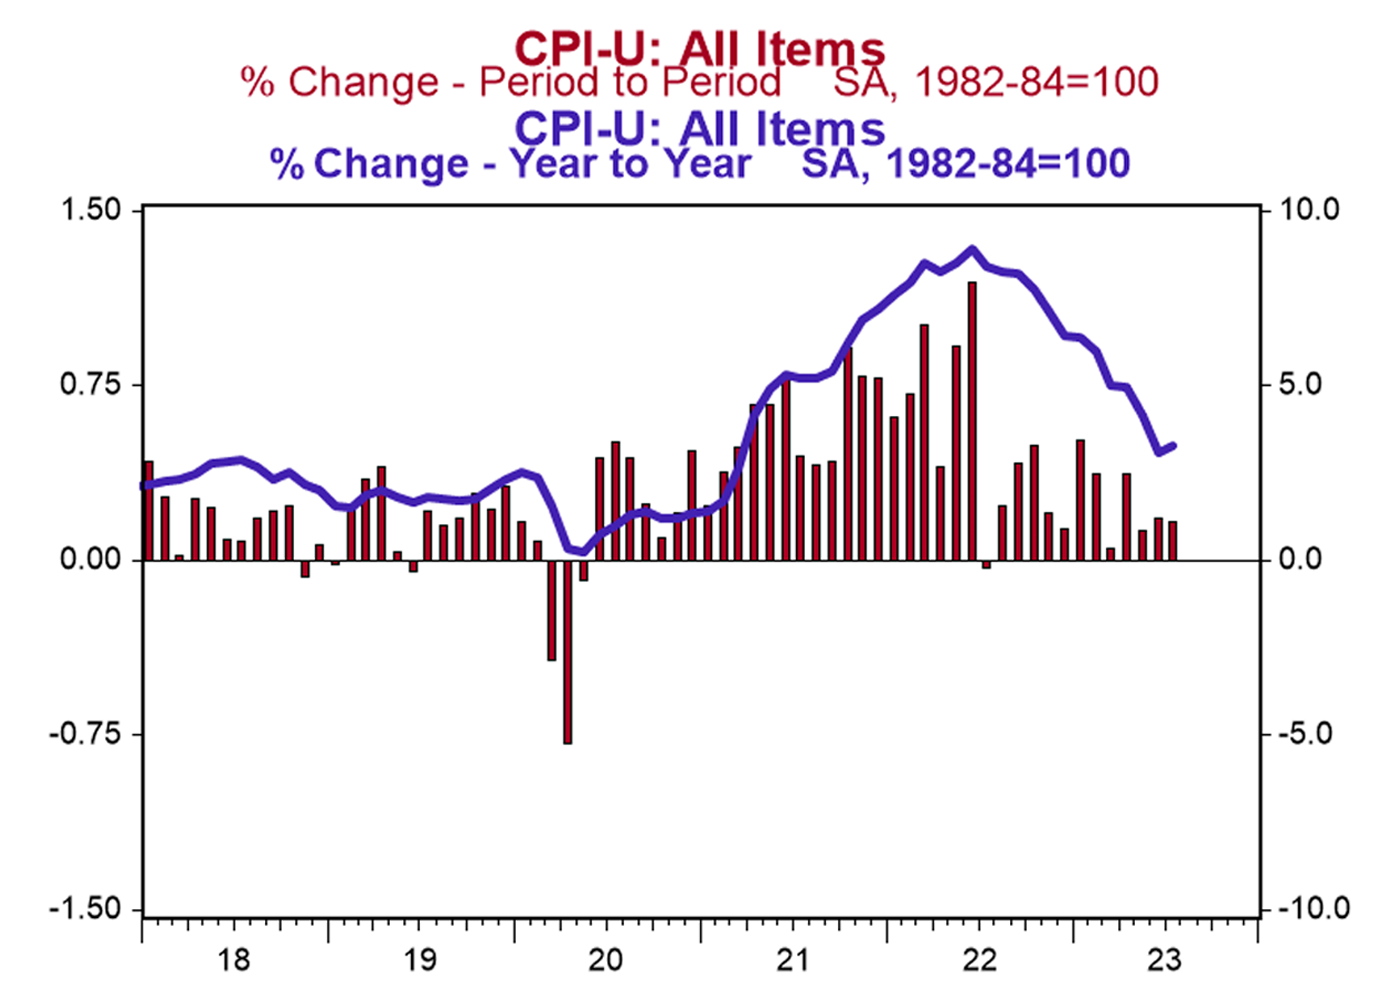
Consumer prices rose 0.2% in July, matching consensus expectations, while the 12-month number came in at 3.2%, a huge improvement over the 8.5% 12-month change as of July 2022. In the past three months, the CPI is up at only a 1.9% annual rate, the smallest three-month reading since the onset of COVID.
While that is welcome news, other data shows no one should be sanguine, especially given the rise in gas prices. “Core” prices—which exclude the effects of the typically volatile food and energy sectors—remain elevated, up at 3.1% and 4.1% annualized rates in the last three and six months, respectively. Rental inflation—both for actual tenants and the imputed rental value of owner-occupied homes—continue to run hot, up 0.5% for the month and running near or above a 6% annualized rate over three-, six-, and 12-month time frames.
Meanwhile, a subset category of inflation that the Federal Reserve is watching closely, known as the “super core”—which excludes food, energy, other goods, and housing rents—rose 0.2% in July and is up 4.1% in the last 12 months. Coupling that with a resilient U.S. labor market, Powell and Co. still have plenty of reason to keep monetary policy tight in the months to come.
Looking at the details of the Aug. 10 report, inflation was held down by several categories that declined in July, led by a dip in prices for airfare (-8.1%), used vehicles (-1.3%), and hospital services (-0.4%). The reason for the moderation in inflation this year is that the money supply stopped growing rapidly after surging in 2020–2021. The M2 measure of money is down 3.6% versus a year ago. If this persists—and it remains to be seen whether it will—it would eventually bring inflation back down to the Fed’s 2.0% target.
For now, the Fed has gained some traction in its fight against inflation, but the battle is not over. In other news, initial claims for jobless benefits rose 21,000 to 248,000, while continuing claims fell 8,000 to 1.684 million. These figures suggest continued job growth in August, although not as fast as earlier this year.

Source: U.S. Department of Labor
How do defensive sectors perform in periods of elevated inflation?
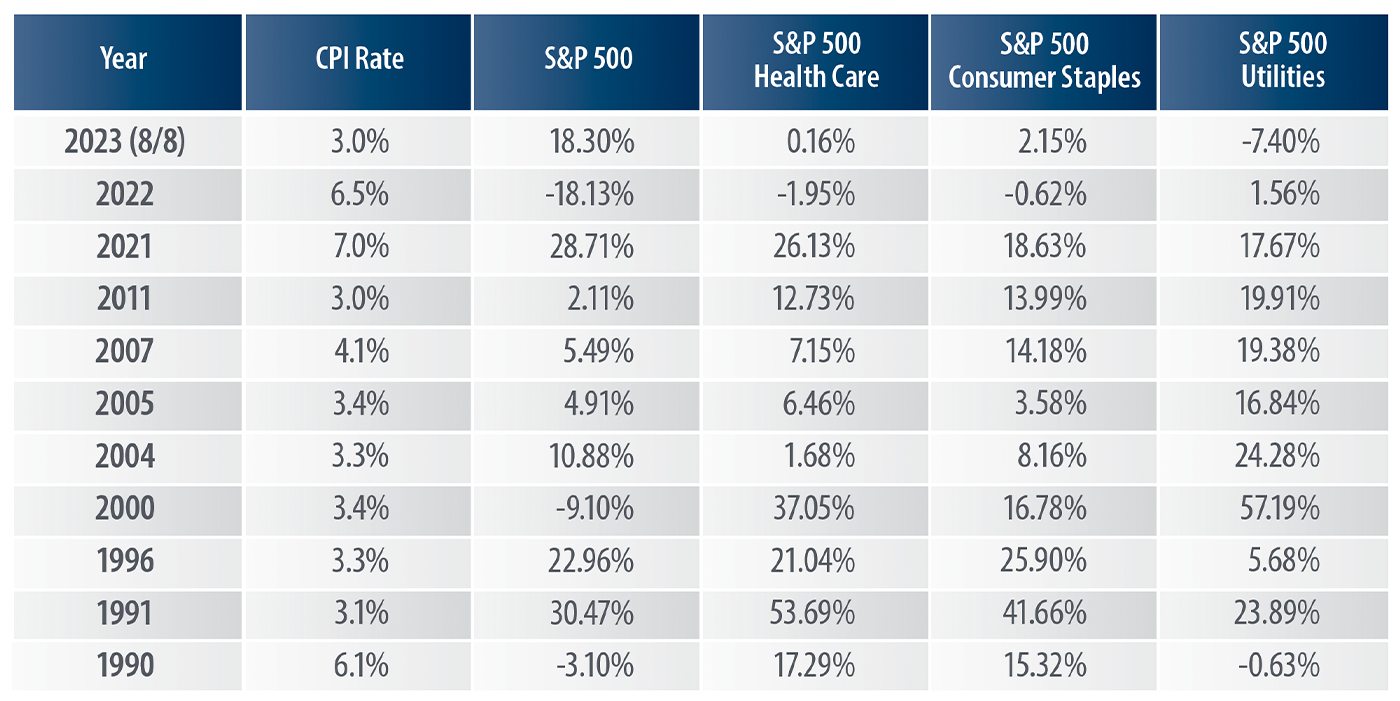
We looked back to 1990 and selected calendar years where inflation, as measured by the CPI, rose by 3.0% or more on a trailing 12-month basis. We chose 3.0% as our baseline because the rate of change in the CPI averaged 3.0% from 1926–2022, according to data from the Bureau of Labor Statistics. Once we had our time frames, we selected three defensive sectors (Health Care, Consumer Staples, and Utilities) and compared their total returns to those of the S&P 500 Index.
The total returns for the three defensive sectors were higher than the total return for the S&P 500 Index in five of the 11 time frames presented (1990, 2000, 2007, 2011, and 2022; see the following table).
S&P 500 DEFENSIVE SECTORS VS. S&P 500 INDEX: TOTAL RETURNS
(YTD & YEARS IN WHICH TRAILING 12-MONTH CPI ≥ 3.0%)

Note: This chart is for illustrative purposes only and not indicative of any actual investment. The illustration excludes the effects of taxes and brokerage commissions or other expenses incurred when investing. Investors cannot invest directly in an index. The S&P 500 Index is an unmanaged index of 500 companies used to measure large-cap U.S. stock market performance. The respective S&P 500 Sector Indices are capitalization-weighted and composed of S&P 500 constituents representing a specific sector.
Source: Bloomberg. CPI rate for 2023 as of 6/30. Past performance is no guarantee of future results.
Additionally, the S&P 500 Index outperformed all three of these defensive sectors in just two of the 11 periods presented in the table (year to date through 8/8 and 2021). Because defensive sectors tend to be less cyclical, they may offer better performance than their counterparts during periods of heightened volatility. The table above reveals that defensive sectors may offer better performance relative to their peers during periods of higher inflation as well.
From 12/29/89–8/8/23 (the period captured in the table above), the average annualized total returns posted by the four equity indexes in the table were as follows (best to worst): 11.62% (S&P 500 Health Care), 10.53% (S&P 500 Consumer Staples), 10.10% (S&P 500), and 7.96% (S&P 500 Utilities)—according to data from Bloomberg.
Takeaway: As the table above reveals, the S&P 500 Index outperformed the Health Care, Consumer Staples, and Utilities sectors in just two of the 11 time frames presented (year to date through 8/8/23 and in 2021).
In our opinion, the year-to-date total returns for the defensive sectors are likely a reflection of a stunning retreat in the CPI over the past year. As of 6/30/23, the CPI stood at 3.0%, down sharply from its most recent high of 9.1% on 6/30/22. That said, investors will often use defensive sectors as a safe haven during times of increased volatility, as well as during periods of heightened inflation. From our vantage point, tighter monetary policy, declining corporate earnings, and increasing price pressures, among other metrics, could be an indication that heightened volatility is on the horizon.
The opinions expressed in this article are those of the author and the sources cited and do not necessarily represent the views of Proactive Advisor Magazine. This material is presented for educational purposes only.
First Trust Portfolios LP and its affiliate First Trust Advisors LP (collectively “First Trust”) were established in 1991 with a mission to offer trusted investment products and advisory services. The firms provide a variety of financial solutions, including UITs, ETFs, CEFs, SMAs, and portfolios for variable annuities and mutual funds. www.ftportfolios.com
RECENT POSTS


