I developed a seasonal model some time ago that I use sparingly in conjunction with a number of other macro indicators. However, there are some historical pockets of strength in different ETFs that cannot be ignored. The impact of long-term seasonal trends of these ETFs may provide insights on how various sectors will perform over the next several months.
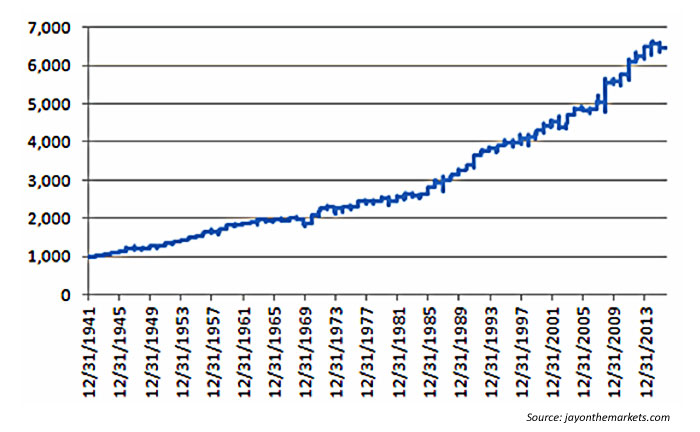
I recently reviewed Jay Kaeppel’s analysis of the “Santa Claus rally” from 1942 through 2015. He used the example of buying the Dow 30 (DJIA) the last six trading days of November and selling on the last day of the year. The results were better than I remembered, with nearly 84% of the years being up, and the up-period average results were nearly double the down-period declines. So, it would appear that seasonality is pretty baked into the markets going into the rest of 2016.
FIGURE 1: THE SEASONAL IMPACT OF THE SANTA CLAUS RALLY
Growth of $1,000 invested in the Dow only during the last six trading days of November and the entire month of December, 1942–2015

The results of the long-term seasonal ETF model have a few macro criteria (and many other micro criteria). First, each ETF must have existed at least 10 years—each seasonal study starts at the ETF’s inception. Each ETF should also have equal-weighted, nonoverlapping subperiods within the full period. Second, the percentage of positive subperiods must exceed 60% consistently. Third, the average of the subperiod positive gains should strongly overshadow the average of negative losses. Keep in mind, there are periods of return drift within the longer seasonal measurements. What may have consistently good results over the last 20 years may be languishing in the past five years. Therefore, a score of the subperiods weights heavier to the most recent and least to the oldest.

Seasonal candidates for the month of December lean toward some industry-specific ETFs (in order of historical strength): homebuilders (XHB), medical devices (IHI), and defense and aerospace (ITA). Here are top performers historically at the sector level: health care (XLV), utilities (XLU), and industrials (XLI). In bond land, high yield (HYG) has a decent showing. For broad indexes, mid-caps (MDY) and small caps (IWM) are more consistent than the S&P 500 or NASDAQ 100. Though the U.S. dollar has rallied lately, December is not usually a good month for it. December tends to be a richer environment for consistent seasonality compared to January, or the worst month during this period, February.
Seasonal candidates for January 2017 are strongly leaning toward precious-metal ETFs such as gold (GLD) and silver (SLV). Both have demonstrated a high level of consistency with strong returns in those months—despite SLV’s decline since 2011 highs and GLD’s rocky downward decline since 2013. In bond land, 7-10 year bonds (IEF) faired the best. The health care (XLV) sector and medical devices (IHI) ETF sector continue to exhibit consistency, but the other sectors and industries that shined in December fall off the map. The S&P 500 (SPY) is by far the most consistent in January, as all other indexes lose consistency and become spotty in their returns.
Finally, seasonal candidates for February 2017 for industries and sectors (in declining order) are retail (XRT), materials (XLB), energy (XLE), and, to a lesser degree, consumer discretionary (XLY). Among major indexes, the mid-cap index (MDY) is the strongest. Silver (SLV) continues to shine, and gold (GLD) does well also. Bonds are blah.
A few months ago, I noted some seasonal trends for the September–November period in the article “Navigating seasonal market trends: The September–November ‘V-shape.’” Those suggested allocations have not done as well as an investment purely in the S&P 500, but did perform fairly well versus a 60%/40% stock/bond mix.
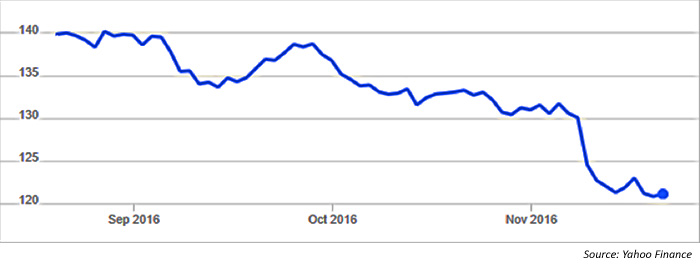
The collective sector recommendation of XLI, XLK, XLP, and XLY has outpaced the S&P 500 soundly, though IEF and IEI have been relatively sedate. But the recommended allocation into TLT (iShares 20+ Year Treasury Bond ETF) is what is giving indigestion overall (especially since the U.S. election). So, as often as I provide some ideas to consider that turn out well—sometimes there is a stinker!
FIGURE 2: SEPTEMBER–NOVEMBER 2016 PERFORMANCE OF TLT ETF

The opinions expressed in this article are those of the author and do not necessarily represent the views of Proactive Advisor Magazine. These opinions are presented for educational purposes only.
 Ian Naismith is a partner and the index designer of Smooth Sailing Indexes Inc., which is a leader in tactical “risk-on/risk-off” index development. Mr. Naismith has been analyzing and trading the markets since the early 1990s. He is a member of the National Association of Active Investment Managers (NAAIM) and has also served as board member and president. www.smoothsailingindexes.com
