


The distinctive lag and persistent selling of small-capitalization stocks that precedes nearly every major market top has been among the longest-standing historical observations within Lowry Research’s analysis.
The development of Lowry’s Operating Companies Only (OCO) data in 1990 made these conditions more apparent. Lowry’s OCO data utilizes only the common stocks from the New York Stock Exchange (NYSE), removing the interest-rate-sensitive non-operating issues that can, at times, distort the NYSE all-issues Advance-Decline Line. After this, Lowry categorizes the remaining operating companies into large- mid-, and small-cap stocks.
Relative weakness in small-cap breadth has been identified by negative divergences in Lowry’s OCO Small-Cap Advance-Decline Line from its large- and mid-cap counterparts. Market breadth refers to the levels of participation of stocks during an advance. The stronger the breadth, the more individual stocks are participating in the rally, which makes for a resilient, healthy market condition.
This weakness stems from the fact that small-cap stocks are historically riskier and more economically sensitive at a time when investor demand is typically becoming more selective. At major market tops, small-cap weakness classically bleeds into mid-cap stocks and finally into the large-cap stocks as investor demand continues to wane.
The cascade of weakening breadth ultimately makes its way to the OCO Cumulative NYSE Advance-Decline Line in the form of a negative divergence versus the major price indexes. This means, although the major price indexes are still reaching new highs, they are doing so on the back of a smaller group of stocks—usually the best capitalized, most well-known stocks.
As it relates to the current market condition, in the context of an intact bull market, the question is “Are all bouts of relative weakness in small-cap breadth reasons to prepare for the demise of a prevailing stock market advance?”
What our studies have found using Lowry’s Segmented OCO data is that the context that precedes the lag in small-cap breadth is the most important part of interpreting the meaning of the underperformance and estimating its consequences. Given the uniqueness of the bull market from 2009 and the understanding that every bull market has its own character, we chose to study severe corrections since 2009 (2011, 2015/2016, and 2018) to gain insight into differentiating between periods of small-cap relative-breadth weakness.
Throughout the course of the bull market beginning in 2009, we observed that, even for significant market corrections (not just bull market tops), when small-cap breadth diverged from further gains in their larger-capitalization peers after long advances, there were indeed negative intermediate-term consequences for the overall market. However, we learned that not all periods of underperformance in small-cap breadth had negative intermediate-term implications. In fact, some periods even represented an opportunity for further intermediate-term market strengthening.
Similarly, drawing the conclusion that weakness in small-cap breadth definitively means a new bear market is imminent would be akin to sighting a leafless forest without knowing what month it is and concluding that it must be winter. Of course, trees are often also bare in the early part of spring or later.
In this case, as with small-cap weakness, context is gained by knowing what came before it. Since 2009, we found that long-lasting lags in small-cap breadth following severe corrections occurred on three consecutive occasions. With one of those periods still ongoing, it is noteworthy, though not predictive, that the prior two lags after deep corrections were not harbingers of another major market decline.
Among the commonalities between these periods of correction/recovery and likely contributing factors to the gradual broadening of the subsequent market advances was the presence of robust market breadth.
We observed that once the post-correction hangover in small-cap stocks ended in these two prior instances, as defined by a new high in Lowry’s OCO Small-Cap Advance-Decline Line, there was a tendency for small-cap stocks to “catch-up” and outperform for a time.
From that point, perhaps since there are so many more small-cap stocks than large-cap stocks, these improvements in small-cap breadth had the effect of refreshing overall market breadth and broadening its leadership.
This progression is typically the sign of an advance closer to the middle of its climb than the end. So, it appears just as there tends to be a migration out of (riskier) small-cap stocks moving toward major market tops and significant corrections, there may also be gradual movement back into smaller-cap stocks as investors gain confidence in the bull advance.
- Small-cap stocks were the first to begin showing weakness going into these severe corrections, with divergences between the OCO Small-Cap Advance-Decline Line versus the Large-Cap Advance-Decline Line ranging from three months in 2011 to three weeks in 2018.
- Small-cap stocks endured the greatest damage during the corrections in terms of percentage drawdowns in the S&P 600 Index and by measure of Lowry’s Percent of OCO Stocks 20% or More Below 52-Week Highs.
- In terms of breadth, large-cap stocks were the first to recover, followed closely by mid-cap stocks, and then eventually small-cap stocks.
- From the time the OCO Small-Cap Advance-Decline Line began reaching new post-correction highs to its next peak, small-cap stocks outperformed large- and mid-cap stocks.
- All three corrective periods were accompanied by economic uncertainty. This is relevant since small-cap stocks are historically more economically sensitive and carry more risk.
- Breadth led major index prices to new highs on the recoveries from each correction.
- Since the 2009 bear market bottom, negative divergences in the OCO Small-Cap Advance-Decline Line versus other segments after long market advances served as early warnings of internal market deterioration well ahead of the final price highs. As such, divergences under these circumstances should be cause for concern (as exemplified in April–July 2011, April 2015–May 2015, August–September 2018). In these instances, divergences from the OCO Small-Cap Advance-Decline Line forewarned of damaging market corrections.
- However, when market breadth leads prices to new highs after severe corrections, a lag in small-cap breadth should not be alarming on its own (i.e., not a sign of an impending bear market). Instead, it is likely evidence of decreased risk appetite and extensive repair of the disproportionate damage done to the great majority of small-cap stocks by the recent, deep market correction.
- Major market tops are typically preceded by divergences not only in the OCO Small-Cap Advance-Decline Line versus counterparts, but also by divergences between Lowry’s OCO Cumulative Advance-Decline Line and the major price indexes. The latter reflects the gradual loss of buying interest on the part of investors as they move out of small-, mid-, and finally large-cap stocks. See the following figure for comparison of segmented advance-decline lines through July 2019.
LOWRY’S OPERATING COMPANIES ONLY (OCO) SEGMENTED ADVANCE-DECLINE LINES
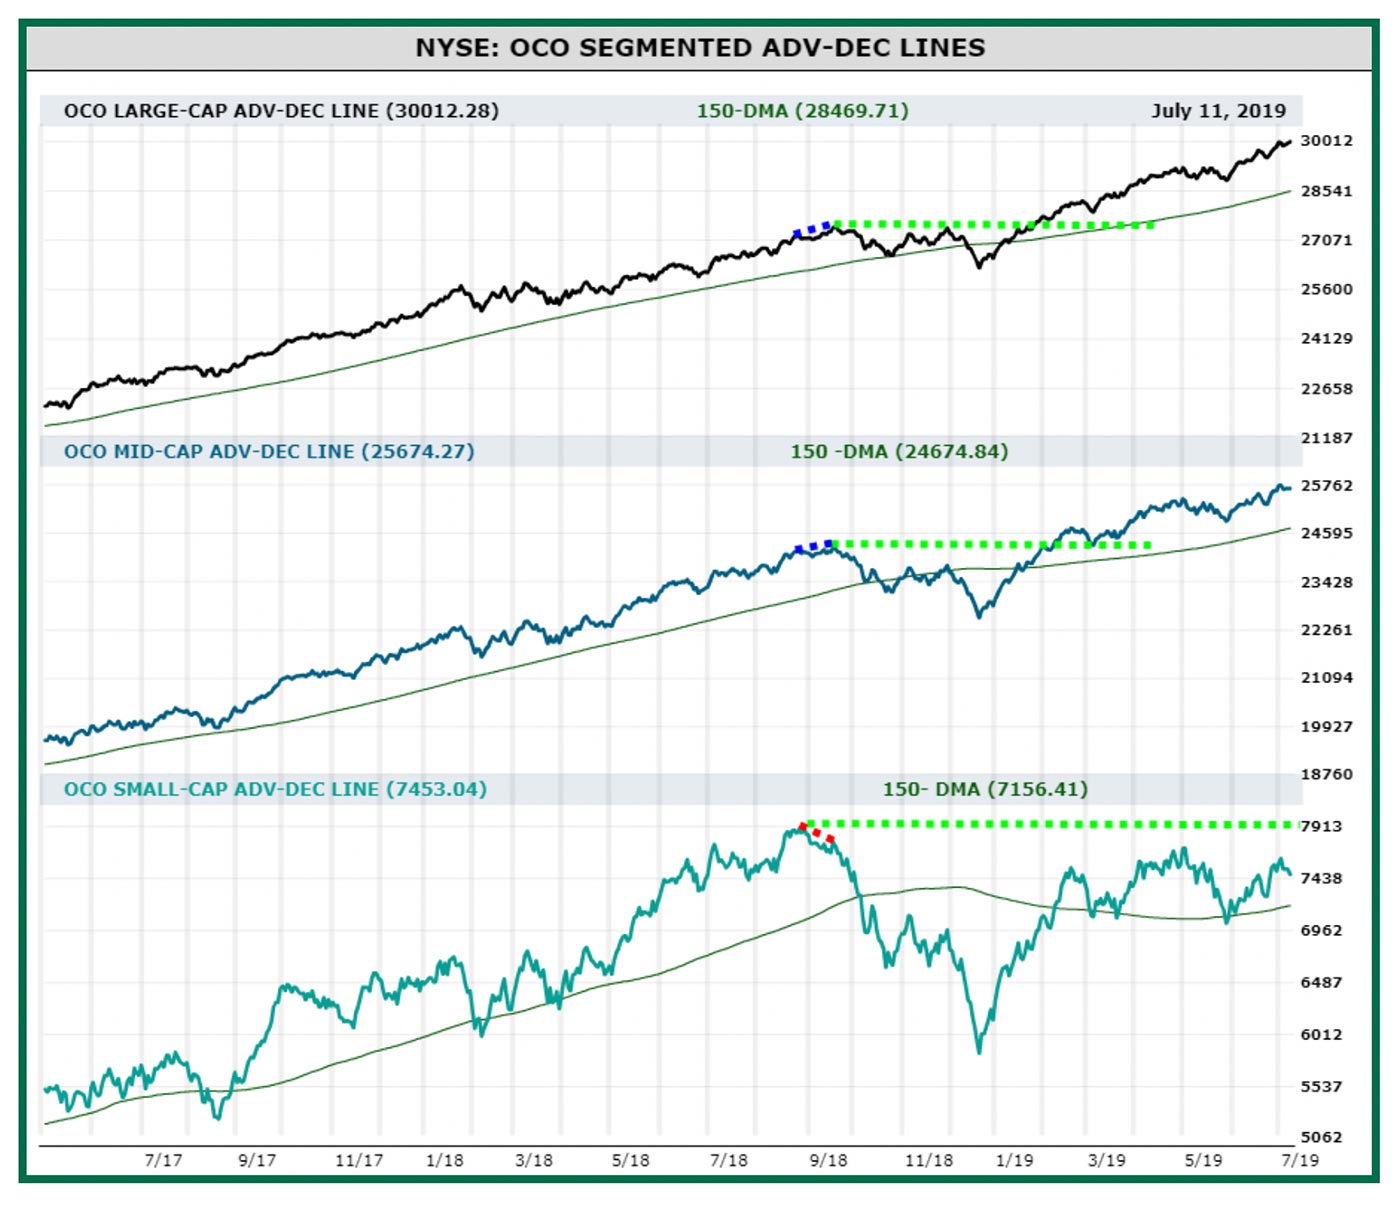
Source: Lowry Research
The opinions expressed in this article are those of the author and do not necessarily represent the views of Proactive Advisor Magazine. These opinions are presented for educational purposes only.
This article is an edited and abbreviated version of the Lowry Research white paper “The Small-Cap Gap: Interpreting Small-Cap Breadth Weakness in the Current Bull Market,” authored by Vincent M. Randazzo, CMT, July 26, 2019.
 Vincent Randazzo, CMT, is a senior market analyst at Lowry Research with more than 15 years of experience in professional equity market research, technical analysis, and market intelligence. Before joining Lowry, Mr. Randazzo was chief market analyst at NASDAQ. He was also director of research at ICAP and a research salesperson at Morgan Stanley and UBS. He has been a Chartered Market Technician (CMT) since 2008. For more information on Lowry Research, please visit lowryresearch.com.