Federal Reserve Chairman Jerome Powell delivered a comprehensive and fairly optimistic speech at Jackson Hole on Friday, which U.S. equity markets applauded with strong gains across major indexes.
Barron’s summarized his remarks as follows:
“Jerome Powell laid the groundwork for the Federal Reserve’s next phase of monetary policy in his speech Friday morning.
“The chairman said he is ready to lower interest rates, citing a cooling labor market and inflation closing in on the central bank’s 2% annual target. Powell is confident that Fed will successfully thread the needle and deliver a so-called soft landing for the U.S. economy. It would be a rare feat, last seen in the 1990s. Getting there will require easing off from today’s high interest rates, Powell said.
“His remarks all but confirm market expectations that the Fed will cut interest rates at the September meeting of the Federal Open Market Committee.”
Barron’s added on Friday, Aug. 23,
“Stocks are sharply higher, led by rate-sensitive, small-cap indexes. Treasury bonds are rallying, with the biggest yield declines coming in maturities under five years. Commodities are moving higher, including gold, which is flirting with a recent high, and the dollar is lower.
“All that is the script markets usually follow when investors and traders see the prospect of easier monetary policy than they had expected. It makes sense that it is happening now because deep cuts in short-term U.S. rates, which the market now expects could be close to 4% by year-end, against a current 5.25% to 5.50%, could provide a lift to the global economy. Stronger growth would benefit commodities including oil, while gold tends to rise when rates fall.”
Are markets entering a challenging seasonal period?
As August comes to a close, markets are entering the historically weakest month of the year. September has averaged a loss of 1.17% for the S&P 500 across all Septembers from 1928–2023.
FIGURE 1: S&P 500 HISTORICAL MONTHLY RETURNS—1928–2024

Sources: LSEG Datastream and Yardeni Research. Data through the end of July 2024.
In addition, when the S&P 500 experienced a decline in September, it had the highest average loss of any month, with an average drop of 4.7% from 1928 to 2023. September is also the only month during this period with more down months (53) than up months (42).
FIGURE 2: AVERAGE LOSSES/GAINS FOR S&P 500 IN UP AND DOWN PERIODS FOR ALL MONTHS

Sources: LSEG Datastream and Yardeni Research. Data through the end of July 2024.
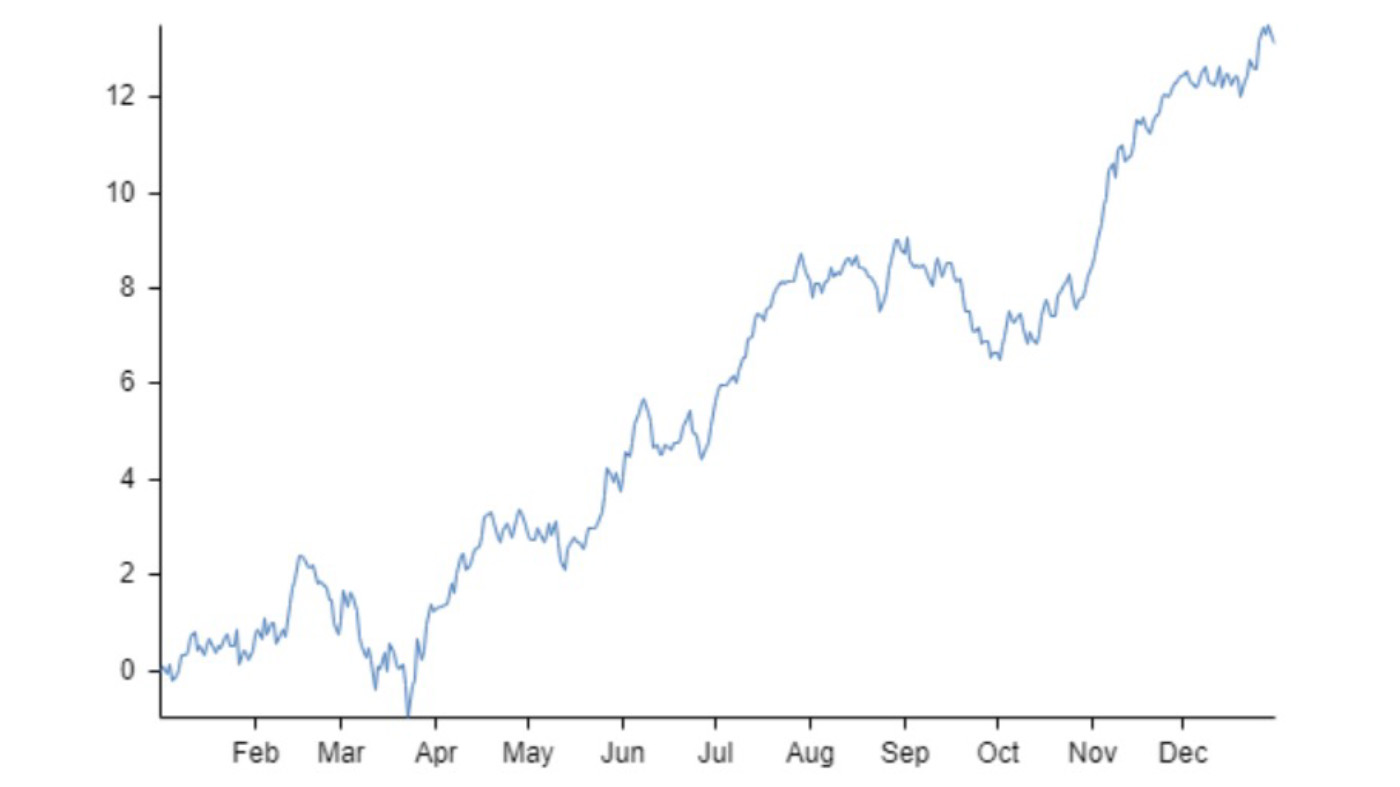
Over the past 10 years, the S&P 500 (as represented by the SPY ETF) has seen fairly dramatic downturns for September and October, followed by a strong recovery toward the end of the year.
FIGURE 3: SPY ANNUAL COMPOSITE CHART (%)—LAST 10 YEARS

Source: Bespoke Investment Group
How has 2024 conformed to annual seasonality patterns?
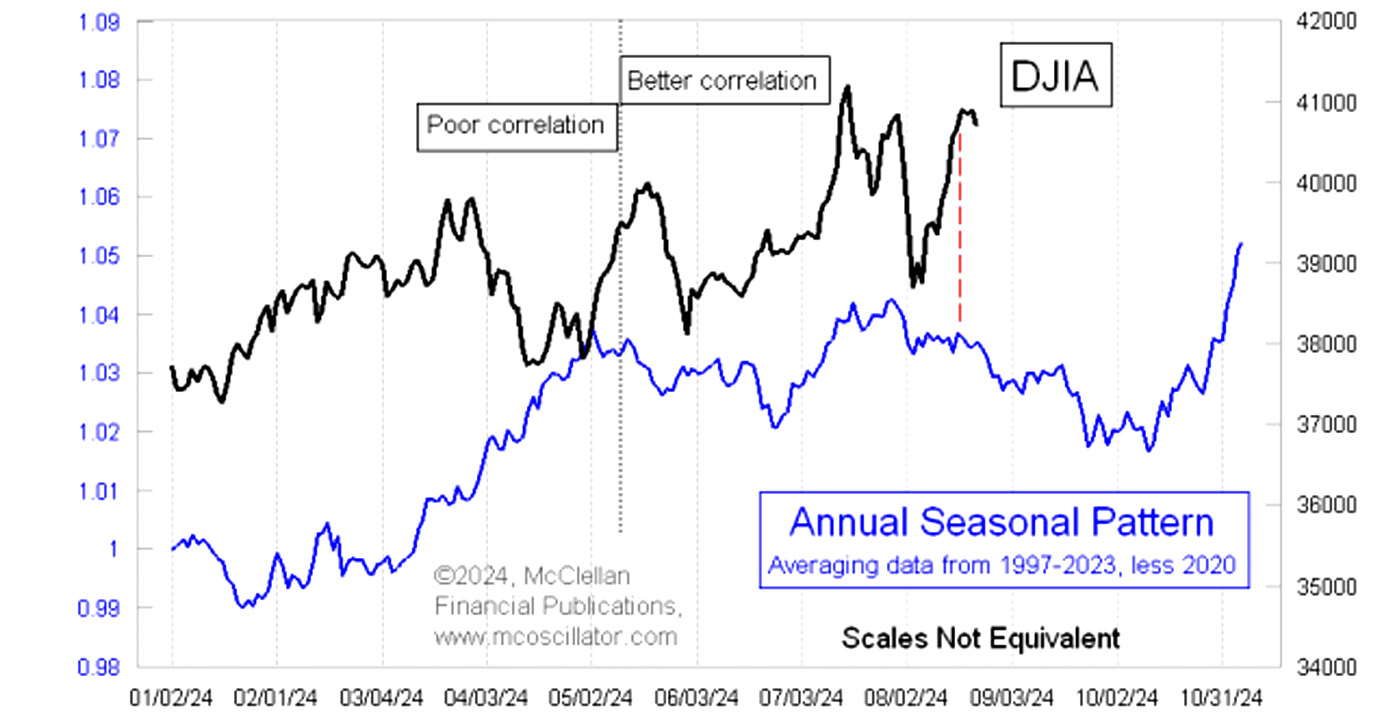
Tom McClellan notes the following about the market’s behavior relative to seasonal patterns so far in 2024:
“Earlier in 2024, the DJIA was not following its Annual Seasonal Pattern (ASP) very closely. But the correlation to that ASP tightened up more beginning in May 2024, and has been working nicely since then. Even the Aug. 5 bottom, which was brought about by a rate hike from the Bank of Japan, seems to have arrived right on schedule. The price rebound since that bottom has been very robust, more so than the ASP suggested, but that is understandable given how oversold that bottom was. The magnitudes of the price movements may not necessarily match what this average pattern shows, but its purpose is not to describe the magnitudes. Rather, its best use lies in modeling the timing of what the stock market does and when.”
FIGURE 4: ANNUAL SEASONAL PATTERN’S LATE SUMMER DIP

Source: McClellan Financial Publications
![]() Related Article: Despite market turmoil, Q2 earnings growth highest since 2021
Related Article: Despite market turmoil, Q2 earnings growth highest since 2021
LPL Financial adds some interesting data on the historical performance of the market under various conditions:
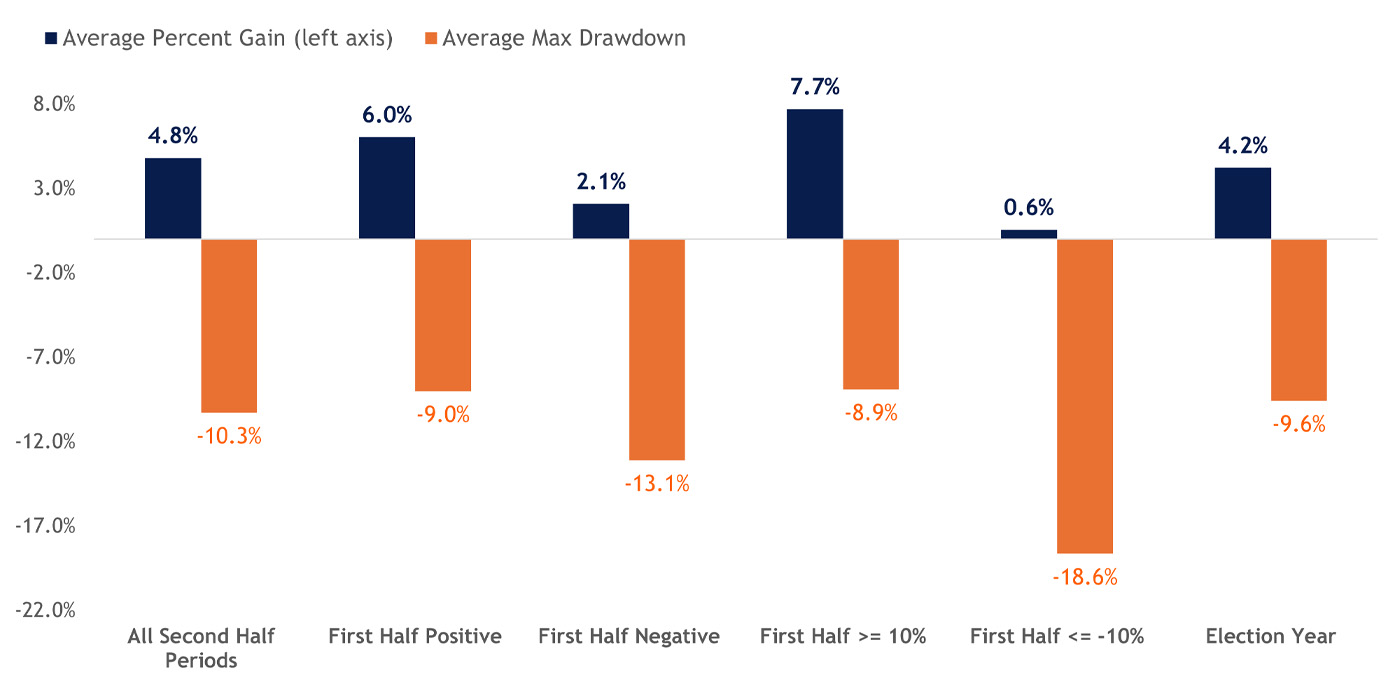
“While elevated valuations, overbought conditions, and underwhelming market breadth point to a potential pause ahead, seasonal trends suggest momentum could continue in the second half. As highlighted below, the S&P 500 has followed up a positive first-half return with an average second-half gain of 6.0%. Furthermore, when first-half gains were 10% or higher, the index posted average gains of 7.7% in the second half, with 83% of occurrences producing positive results.
“Despite the bullish precedence from a positive first half, bull markets are not linear, and pullbacks or even a correction should be expected in the second half. The maximum drawdown for the S&P 500 during the second half has averaged -10.3% since 1950, although second-half drawdowns following a 10% or higher first half average only 8.9%.”
FIGURE 5: SECOND-HALF S&P 500 SEASONALITY—1950–YTD

Sources: LPL Research, Bloomberg. Data as of June 27, 2024.
RECENT POSTS


