On April 8, 2025, the price of U.S. crude oil dropped below $60 per barrel, the lowest level since April 2021, according to CNBC.
CNBC reported,
“U.S. crude oil closed below $60 per barrel on Tuesday, the lowest level in four years as traders fear that President Donald Trump’s sweeping tariffs will trigger a full-blown, global trade war. …
“… Prices are down more than 15% since last Wednesday when Trump announced the new round of import taxes.
“The oil market faces a ‘toxic cocktail’ of recession fears due to Trump’s tariffs and the decision by OPEC+ to bring more barrels back to the market, said Helima Croft, global head of commodity strategy at RBC Capital Markets.
“‘For now people are waiting to see if there’s a potential off ramp to this trade dispute,’ Croft told CNBC’s ‘Squawk on the Street.’”
On April 30, OilPrice.com offered further context:
“Low inventories reported today by the Energy Information Administration (EIA) did nothing to staunch the bleeding, with WTI getting gutted nearly 4% on the day, and Saudi rumors throwing another spanner in the works, while new U.S. economic data suggests more pain is in store for the sector.
“Three weeks ago, eight OPEC+ countries unveiled plans to phase-out their voluntary oil output cuts by ramping up output in May by 411,000 barrels per day—equivalent to three monthly increments. The announcement came at a time when U.S. President Donald Trump announced tariffs on more than 90 countries across the globe, roiling oil markets. The eight OPEC+ countries are due to meet on 5 May to discuss production levels for June, just days after Washington released a worrying economic report. The U.S. economy shrank at an annualized 0.3% clip in the first quarter, marking the first contraction in three years. …”
A lot has happened on the trade/tariff front since early April. WTI crude oil rebounded modestly in mid- and late April, generally trading in the low $60s. But last week, it saw consecutive closes below $60 and an intraday low on May 1 of $56.39—the lowest since the $55.12 intraday low on April 9.
In addition, over the weekend OPEC+ announced plans to increase production. CNBC reported the following:
TABLE 1: WEEKLY WTI CRUDE OIL PRICES
(FRONT-MONTH CONTRACT, $/BARREL)
Data as of each Friday’s close

Note: Markets closed on Good Friday, April 18.
Source: MarketWatch
FIGURE 1: WTI CRUDE OIL PRICES—YEAR TO DATE
(FRONT-MONTH CONTRACT, $/BARREL)

Source: MarketWatch; data through 5/2/2025
Bespoke Investment Group discussed oil’s April performance last Friday:
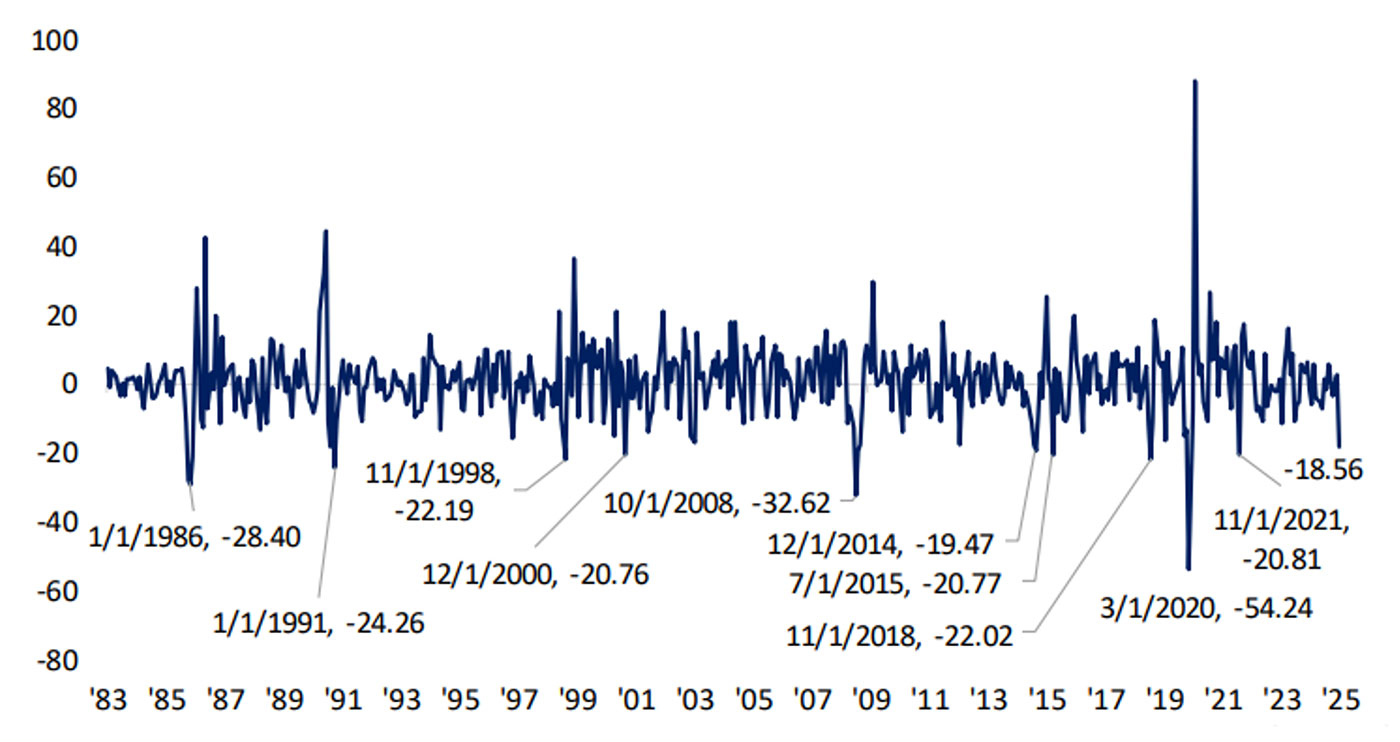
“The decline early this week tacked onto what had been a brutal month for oil. As shown below, WTI dropped 18.56% in April.
“That nearly 20% decline ranks in the bottom 2% of all monthly moves in crude since 1983. Only 13 other months have seen larger declines with the most recent being November 2021. Monthly declines that rank in the 5th percentile or worse have tended to see further declines more often than not in the first week of the next month and out to the next three months. Returns six months and one year later have also tended to be mixed, albeit stronger than those shorter time frames.”
FIGURE 2: FRONT-MONTH WTI CRUDE OIL—MONTHLY % CHANGE (SINCE 1983)

Source: Bespoke Investment Group
Impact on retail gas prices
The slump in crude oil prices should be welcome news for consumers, especially as they contemplate summer driving plans.
However, retail gasoline prices have not mirrored crude’s steep decline so far this year.
Fox Business recently provided the following analysis:
“Oil prices are at their lowest levels since the spring of 2021. …
“Gas prices, however, have risen slightly since January, up approximately 10 cents per gallon, according to the U.S. Energy Information Administration. Still, they are 50 cents lower than they were a year ago. As President Donald Trump crosses the 100-day threshold into his second term, gas prices remain at the core of his promise to reduce energy prices.
“The EIA expects gas prices to ease as the year goes on. According to the agency’s short-term energy outlook in April, ‘The U.S. retail price for regular grade gasoline averages about $3.10 per gallon (gal) in our forecast for this summer (April–September), about 20 cents/gal less than our forecast in the March STEO. The lower gasoline price forecast mostly reflects our expectation of lower crude oil prices. If realized, our forecast gasoline price would be the lowest inflation-adjusted summer average price since 2020.’”
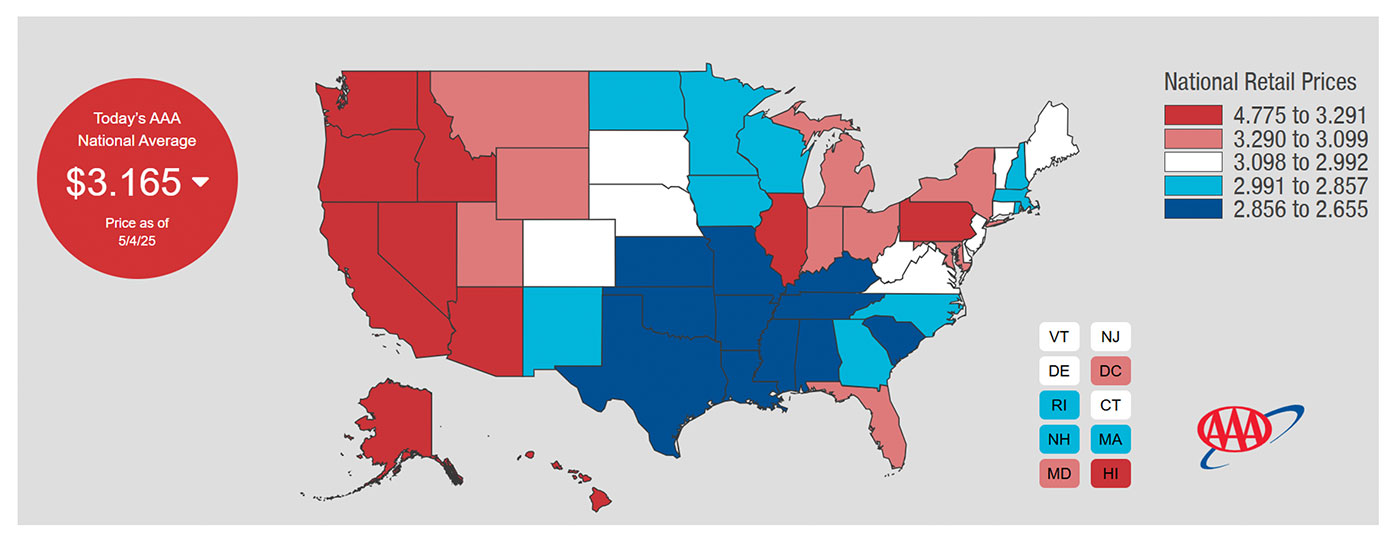
FIGURE 3: CURRENT RETAIL GASOLINE PRICES BY STATE

Source: AAA; data as of 5/4/2025
Lower global growth estimates
U.S. equity markets rebounded strongly through the end of last week from their April lows. According to Barron’s, last Friday marked the ninth straight positive session for the S&P 500, the longest winning streak since November 2004.
Barron’s commented on the S&P 500’s performance during the streak:
However, the prospect of slower growth around the globe remains a primary factor driving declines in energy markets.
S&P Global presented the following analysis:
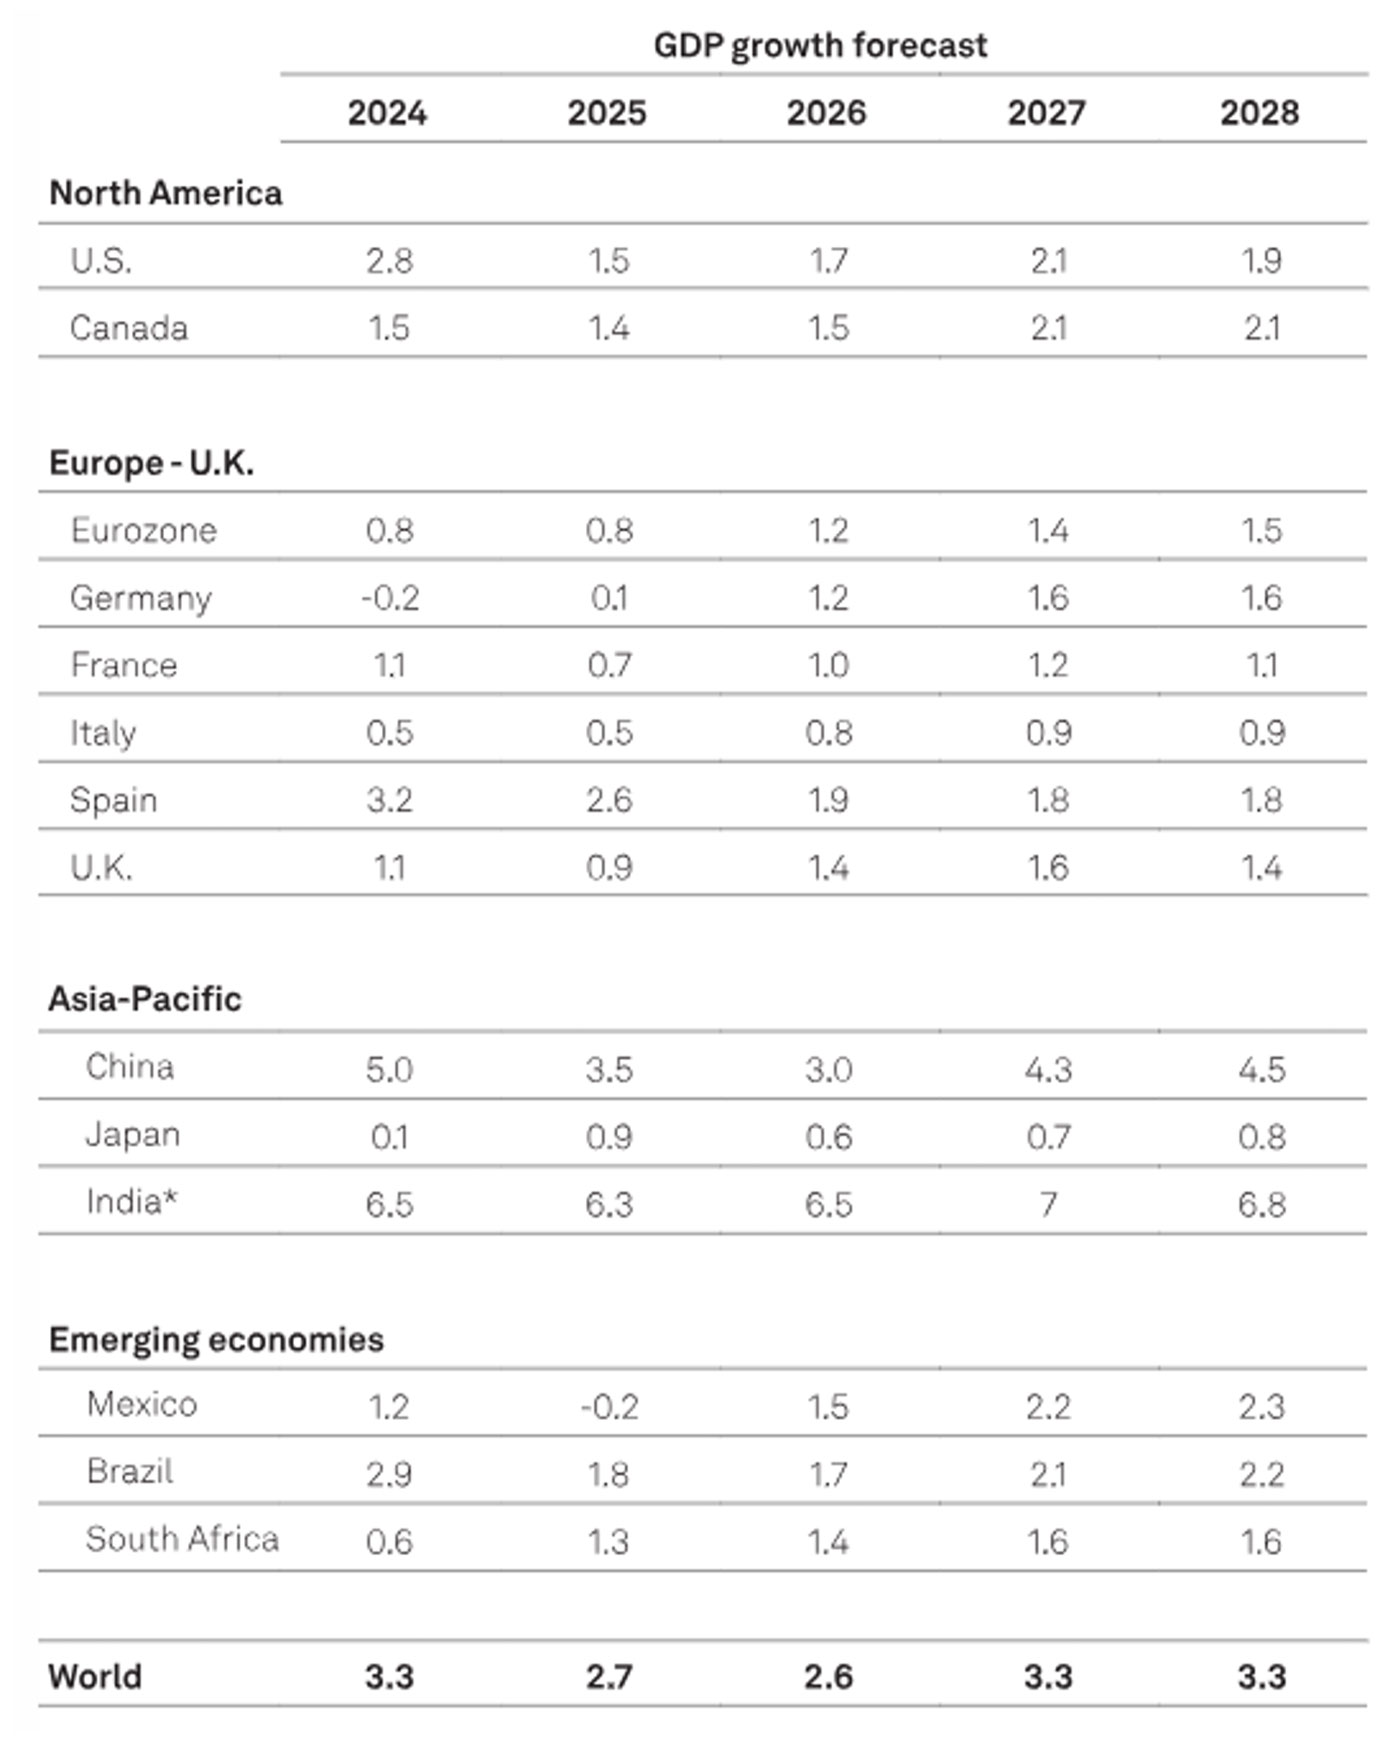
“Much has changed since our previous forecast round in late March. The U.S. administration announced an unexpected, steep rise in tariffs on April 2, 2025. Following the announcement and the aftermath, we are lowering our GDP growth forecasts. Global growth is 0.3 percentage points lower in 2025 and 2026 relative to our previous forecast round, and all regions are affected negatively.”
“Key Takeaways
- “A seismic and uncertain shift in U.S. trade policy has roiled markets and raised the specter of a global economic slowdown. As a result, we have updated our macro view.
- “The jump in U.S. import tariffs, trading partner retaliation, ongoing concessions, and subsequent market turbulence constitute a shock to the system centered on confidence and market prices. The real economy is sure to follow, but by how much?
- “We have again lowered our GDP growth forecasts for most countries and raised our inflation forecast for the U.S. We see a material slowdown in growth, but do not foresee a U.S. recession at this juncture.
- “The risks to our baseline remain firmly on the downside in the form of a stronger-than-anticipated spillover from the tariff shock to the real economy. The longer-term configuration of the global economy, including the role of the U.S., is also less certain.”
(“Editor’s Note: S&P Global Ratings believes there is a high degree of unpredictability around policy implementation by the U.S. administration and possible responses–specifically with regard to tariffs–and the potential effect on economies, supply chains, and credit conditions around the world. As a result, our baseline forecasts carry a significant amount of uncertainty. As situations evolve, we will gauge the macro and credit materiality of potential and actual policy shifts and reassess our guidance accordingly.”)
TABLE 2: GDP GLOBAL GROWTH FORECASTS
(ANNUAL PERCENTAGE CHANGE)

Note: *Fiscal year beginning April 1 in the referenced calendar year.
Source: S&P Global Market Intelligence and S&P Global Ratings’ forecasts
RECENT POSTS


