

Unless you’re blindly indexing, you can’t take indexes at face value—you have to dig deeper. You can accomplish this by using market indicators such as the advance/decline line, percent of stocks above their 200-day moving averages, and so forth. Although these indicators do have their purposes, I prefer to get my hands dirty by looking under the hood.
First, I take a look at all of the stocks within my tradable universe that have an average volume greater than $250K and are hitting new highs. The number of stocks in the list and the makeup of the stocks in the list can be telling. If there are only a few stocks in the list and they are mostly defensive issues or bond related, then the market may be entering a cautious phase. Looking to the new high list on November 11, 2015, the top stocks were mostly bond ETFs, foods, and a few big-cap stocks. This tells me that the market may be in a defensive mode and that the leadership may be narrow.
Several thousand charts
I then dive in by looking at nearly two-to-three thousand stocks in my tradable universe. I don’t obsess over this, but if I do find something interesting, I flag it for further analysis and move on. If you want to become better as a technician, then look at charts, lots of charts. I’ve probably looked at over 15 million charts over the last 20-something years.
This process gives you a feel for what’s actually happening. Ask yourself, are stocks mostly headed higher? Lower? Or, just plain sideways? Where are the setups? Are there few or many? Are they mostly shorts or longs? Are there any “debacle du jours”—i.e., stocks that were torpedoed? Most stocks, other than the bond-related funds and selected big-cap issues are in downtrends, or at the least, have stalled well short of new highs.
To the sectors
I then focus on the sectors by looking at around 250 sectors/sector ETFs. Right now, many such as Drugs, Health Services, Transports, and Retail have stalled well short of their old highs in their retrace rallies. And, most of those that did make it to new highs, such as Tobacco, Aerospace/Defense, and Hardware, have subsequently come back in.
Last, but not least, the indexes
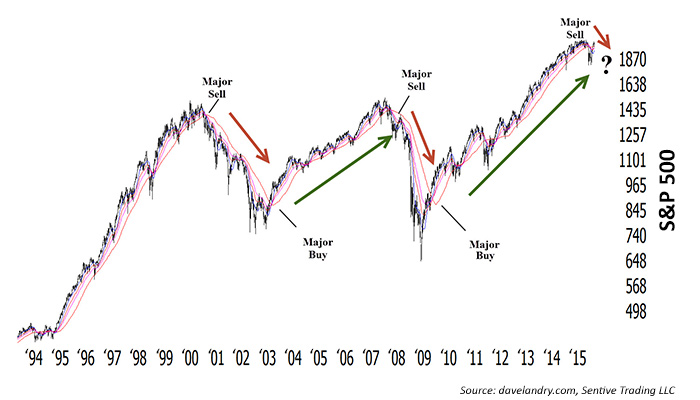
Finally, I focus on the indexes, looking for signals. The S&P 500 recently had a sharp retrace rally of nearly 12% in just over one month. But the market stalled near its prior highs, suggesting that it might be finally catching up to what I’ve seen on internals. Those who failed to sell on the last rally will be forced to rethink things should the recent pullback become more than just that. That’s human nature.
There was also a recent “bowtie” sell signal on the weekly chart. This is where three moving averages (10 simple MA, 20 EMA, and 30 EMA) converge and spread out in the opposite direction over a short period of time, giving the appearance of a bowtie.
As my good friend Greg Morris once said, “We treat each signal as if it will turn into the big one.” And, I fully agree. All tops will have signals but not all signals will turn into tops. But, the last two times this occurred in the S&P (2000 and 2008), the market subsequently dropped well over 40%, so you may want to pay attention. This market is not firing on all cylinders.
MAJOR MARKET BUY AND SELL SIGNALS, 1994–2015
 Dave Landry has been trading the markets since the early 1990s and is the author of three books on trading. He founded Sentive Trading LLC in 1995 and since then has been providing ongoing consulting and education on market technicals. He is a member of the American Association of Professional Technical Analysts and was a registered Commodity Trading Advisor (CTA) from 1995 to 2009. davelandry.com