Many disparate factors may influence the financial markets in the coming weeks—combined with October’s historical tendency to be the most volatile month of the year.
The potential headline risk factors are well-known, though the outcomes are not:
- The outbreak of COVID-19 cases for the first family, close advisers to President Trump, and members of Congress. Additionally, according to The New York Times view of the national picture, “Over the past week, there have been an average of 43,586 cases per day, an increase of 6 percent from the average two weeks earlier.”
- The roller-coaster negotiations for an additional stimulus package that would, at least in theory, give a needed boost to households’ income and result in increased consumer spending. Numerous other provisions, including funding for state and local governments, enhanced COVID testing programs, and support for the airline industry and small businesses are on the table as well.
- The prospects for further economic recovery are unclear, with the most recent employment report coming in below expectations and manufacturing and services data showing alternating signs of notable improvement and then less encouraging results. Barron’s noted this weekend on the state of the economy, “Various real-time gauges, such as the New York Federal Reserve Bank’s Weekly Economic Indicator, have flattened since August.”Although the housing market continues its strength, Bespoke Investment Group reports that “Personal income has been retreating since its Q2 surge, which was driven by stimulus checks and expanded unemployment insurance benefits.” However, they also add, “While personal income is dropping, it is still above pre-COVID levels and the savings rate remains extremely high.”
- Continued focus on the hotly contested national election season, with more concerns perhaps on the orderliness of the election process and reporting of results than the actual outcome.
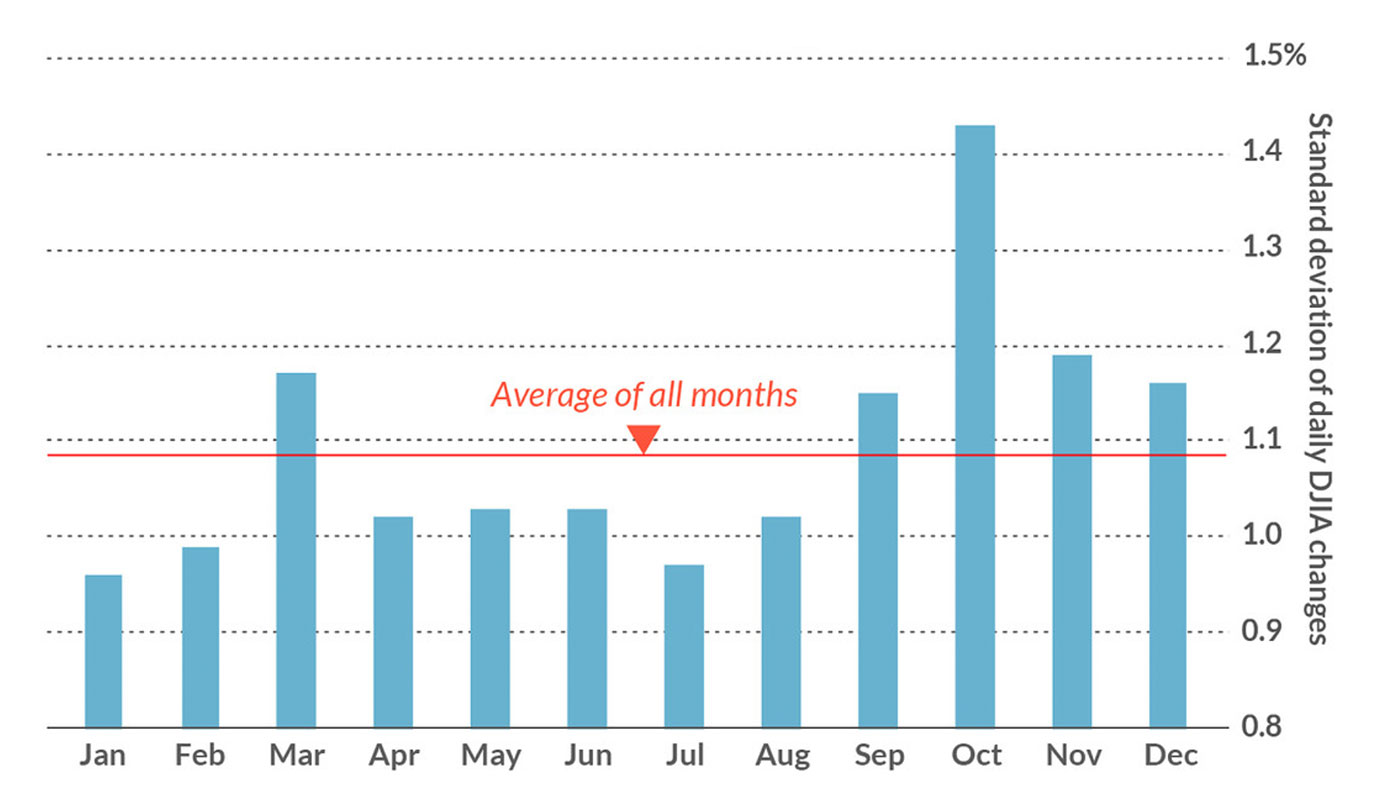
All of this comes in a month known for volatility. MarketWatch plotted the standard deviation of each month’s daily changes in the Dow Jones Industrial Average since 1896. This shows that “October’s is 1.43%, far higher than the all-month average of 1.09%.”

Sources: MarketWatch, www.HulbertRatings.com
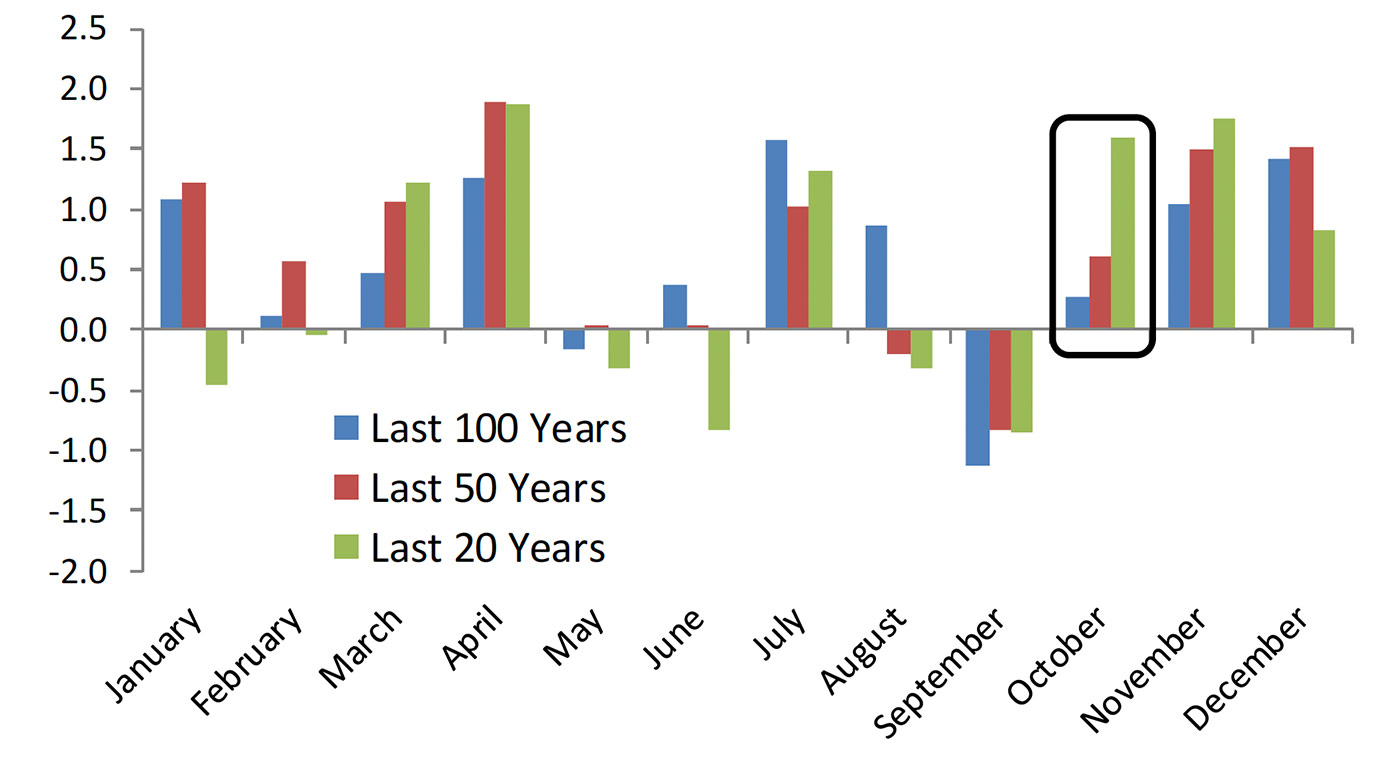
However, as our article this week points out, “volatility cuts both ways” in October. Despite October’s track record of seeing some of the largest market crashes in history, it has, on average, delivered positive returns for equity markets. And, historically, it has been part of one of the strongest three-month seasonal periods for equities.

Source: Bespoke Investment Group
Against this backdrop, the Q3 earnings season will start in earnest in about two weeks. Barron’s says,
Barron’s notes, however, that some analysts do not see a full earnings recovery on the horizon for up to another three years.
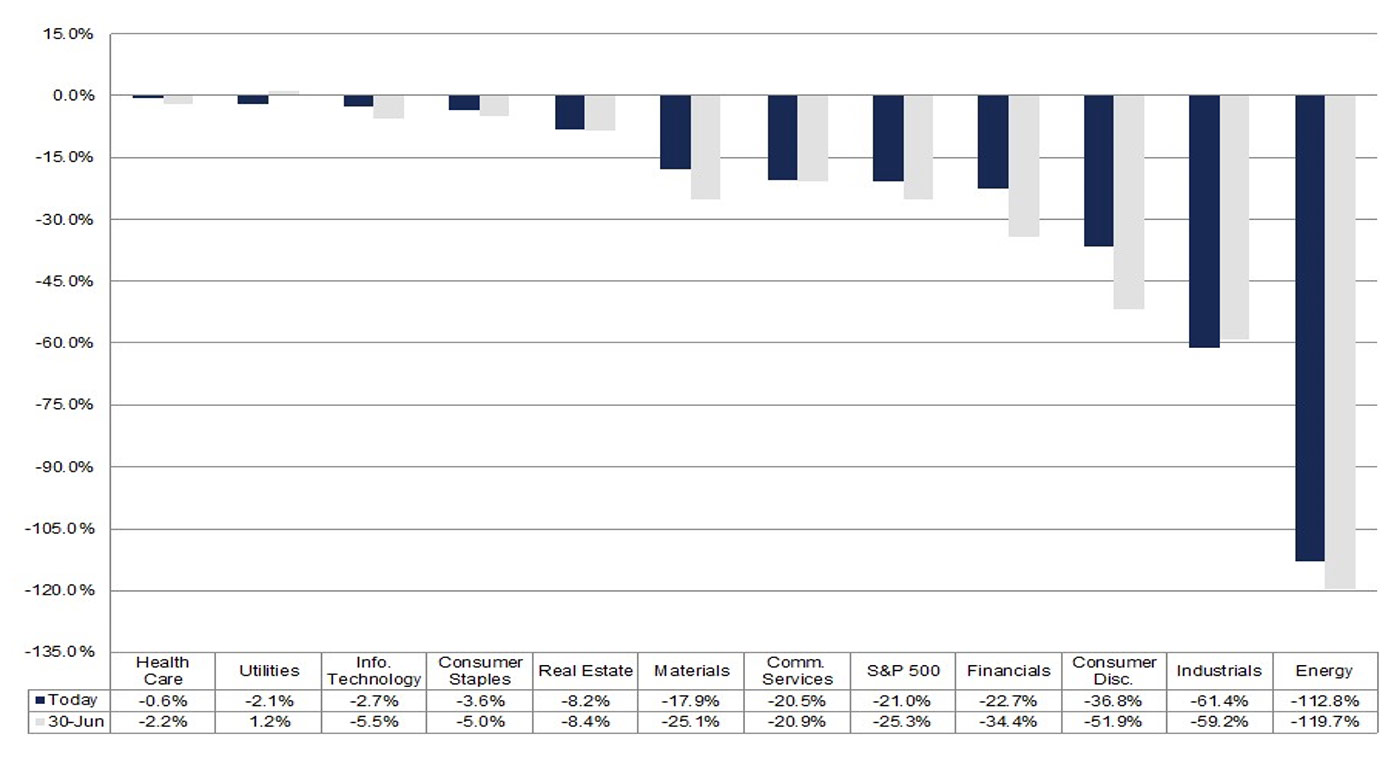
For Q3 2020 earnings season, FactSet is currently projecting a 21% decline in earnings versus the same period in 2019 and a 3.6% decline in revenues. These projections are considerably better than projections as of the end of June (up 4.1%).
FactSet says, “While analysts typically lower EPS estimates during a quarter, they increased EPS estimates during Q3 2020.” To this point, they add, “For Q3 2020 (with 18 of the companies in the S&P 500 reporting actual results), 17 S&P 500 companies have reported a positive EPS surprise and 16 have reported a positive revenue surprise.”
Figure 3 provides a look at FactSet’s current projections for earnings by major sector.

Source: FactSet
