
October is a month that is known for volatility. And that is a well-earned reputation. Crashes in 1929, 1987, and 2008 all occurred in October.
But volatility cuts both ways.
If you break the average year down into one-week periods, October contains some of the strongest seasonal edges of the year, both bearish and bullish. Breaking the year down by week is something I have done numerous times over the years, and it has provided some interesting insights.
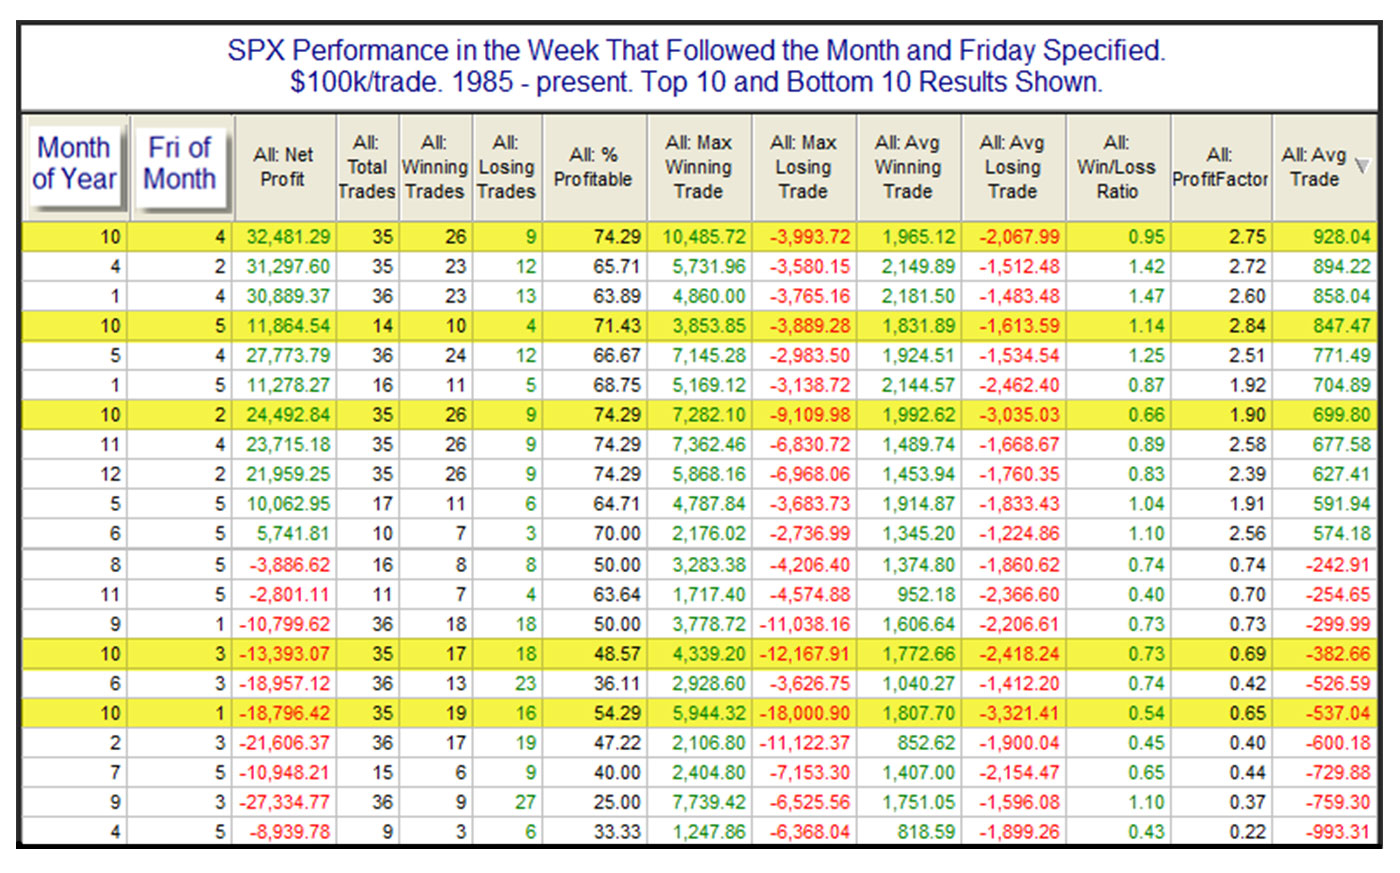
The following table shows stats back to 1985. I chose 1985 as the start date because SPX (S&P 500) options trading began in 1984, so 1985 is the first full year where there was an options expiration schedule. We have found over the years that options expiration can generate strong trading edges. Action on and around options expiration, which occurs on the third Friday of each month, helps to generate some seasonal tendencies. This study encompasses the full range of time that SPX options have been in existence.
The study assumes a hypothetical trade of $100,000 going long some trading instrument related to SPX, which could be executed through either an ETF, options, or futures. Values are calculated using the index levels of SPX itself, so an unleveraged ETF such as SPY would most closely replicate these results. In measuring performance, a “trade” was assumed to have occurred on the close of the Friday listed. That trade was exited at the close of the following Friday. (Thursday was used for any week in which Friday was a holiday.)

Source: QuantifiableEdges.com
You’ll note that the highlighted entries occurred in October. It’s amazing that all five potential weeks in October are included in either the “Best 10” or the “Worst 10” weeks of the year. Weeks are ranked based on average trade (last column).
Weeks following the first and third Friday in October have been among the worst on average. I’ll also note that the two largest “max losing trades” (a 12% and an 18% drop) occurred following the first and third Friday in October.
Weeks following the second, fourth, and fifth Fridays in October made up three of the best 10 weeks of the year on average. And the second and fourth weeks show two of the biggest winners as well, with 7.3% and 10.5% max gains.
There is no doubt that October can be volatile. Traders may want to keep the patterns of the last 35 years in mind. Seasonality will be swinging back and forth between bullish and bearish. Paying some attention might help your accounts survive any market “scares” before Halloween.
 Rob Hanna has worked in the investment industry since 2001. He is the founder and publisher of Quantifiable Edges, a quant-based website where he also publishes a newsletter. After managing a private investment fund through Hanna Capital Management LLC from 2001 to 2019, Rob joined Capital Advisors 360, where he now serves as a registered investment advisor and focuses on short-term and quantitative strategies. quantifiableedges.com
