Implications of the 7-year cycle in margin debt
Implications of the 7-year cycle in margin debt

Total margin debt has been rising sharply, drawing a lot of attention. High margin debt has been present at major market price tops in the past. But this relationship is more than just an indicator of overbought conditions.
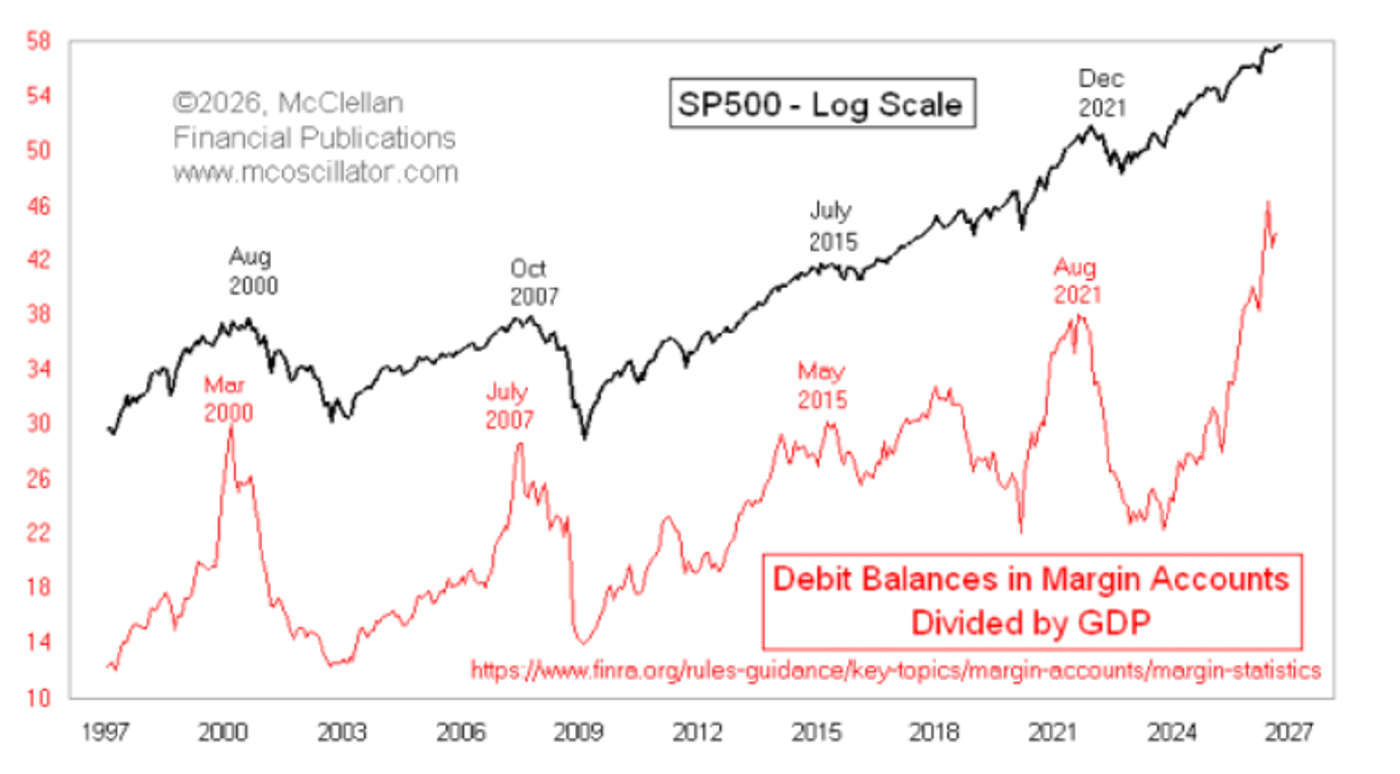
Lars von Thienen of the Foundation for the Study of Cycles recently filmed a great video in which he looks at the cycle implications of these data. He used cycle analysis software to detect a dominant seven-year cycle, which we have recreated in Figure 1. Instead of using raw margin debt numbers, the chart follows Lars’ approach and plots margin debt divided by GDP.
FIGURE 1: S&P 500 PRICE TREND COMPARED TO MARGIN DEBT/GDP (1997–2026)
Source: McClellan Financial Publications
 Related Article: Bull market strength masks growing economic risks
The cycles software Lars uses actually yields a period length of 81 months, and it also shows a half-period harmonic cycle of 43 months.
I find that the seven-year period is the much more important cycle. If we assume this cycle continues, then the next top for margin debt and the stock market is due in 2028. Lars also made an interesting observation that the ratio of margin debt to GDP usually peaks a few months before the final price high in the S&P 500.
The FINRA data Lars used are reported monthly and go back only to 1997. I wanted to investigate whether this seven-year cycle is really durable by looking back further in time.
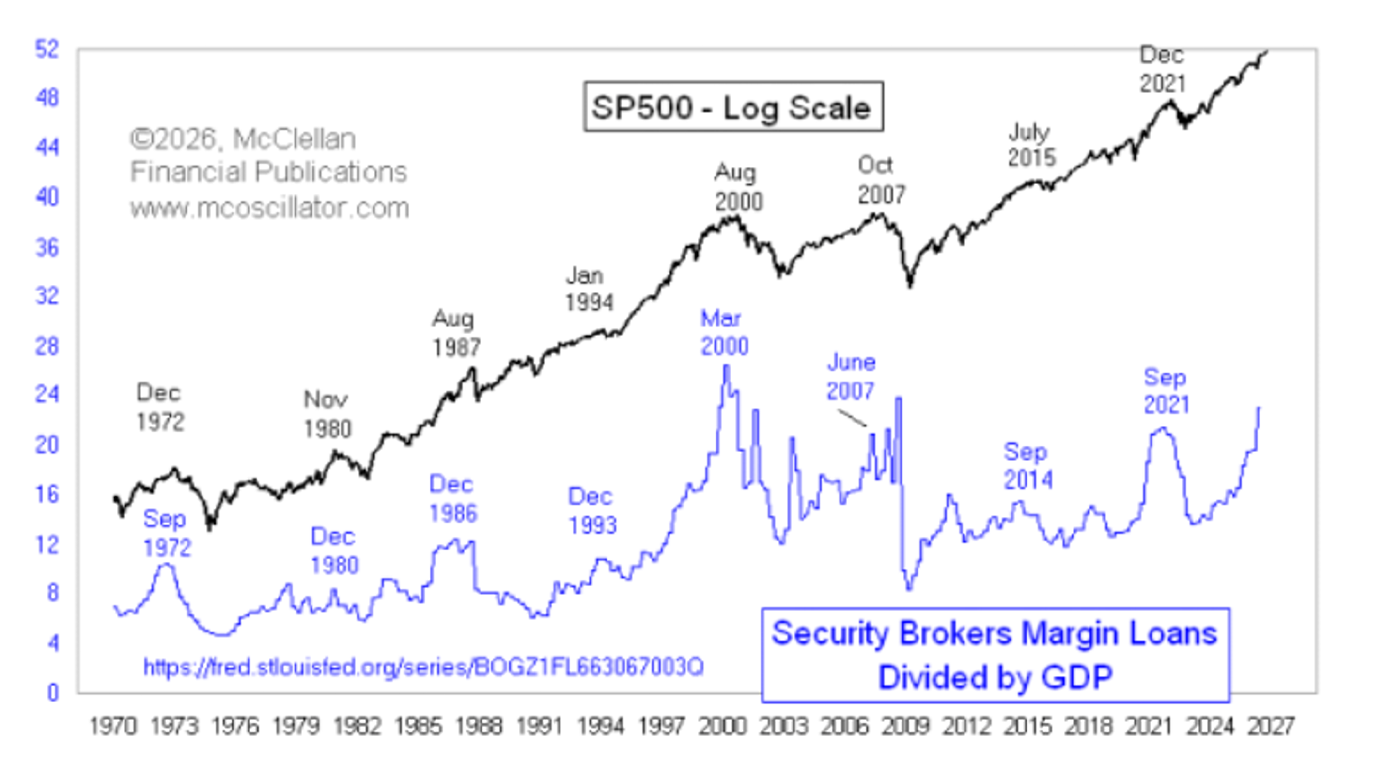
Figure 2 shows similar data published by the St. Louis Fed on its FRED website. These data differ greatly in value and are only available quarterly, but they go back much further. The differences in the ingredients of each data series might interest statisticians, but they are not very relevant for examining the cyclical phenomenon, which appears in both series.
FIGURE 2: S&P 500 PRICE TREND COMPARED TO MARGIN DEBT/GDP (1970–2026)
Source: McClellan Financial Publications
There is an unusual anomaly in the FRED data in the lower chart in late 2008: an upward spike that does not match the other data, nor does it match what the stock market was doing. That was when Lehman Brothers was blowing up, so the data got a little bit screwy. Other than that, the seven-year cycle does show up going back several more iterations, mostly exhibiting the same tendency for the ratio of margin debt to GDP to peak before equity prices. The quarterly data are a bit less precise on that measurement.
The key takeaway is that, yes, margin debt is high now even as a percentage of GDP. But the very strong seven-year cycle is not due to top out until sometime in 2028, so the bull market is more likely to live on and get to an even more extreme condition before it is finished.
This is an edited version of an article that first appeared at McClellan Financial Publications on Oct. 8, 2026.
The opinions expressed in this article are those of the author and the sources cited and do not necessarily represent the views of Proactive Advisor Magazine. This material is presented for educational purposes only.
 Tom McClellan is the editor of The McClellan Market Report newsletter and its companion, Daily Edition. He started that publication in 1995 with his father Sherman McClellan, the co-creator of the McClellan Oscillator, and Tom still has the privilege of working with his father. Tom is a 1982 graduate of West Point, and served 11 years as an Army helicopter pilot before moving to his current career. Tom was named by Timer Digest as the #1 Long-Term Stock Market Timer for both 2011 and 2012. mcoscillator.com
RECENT POSTS