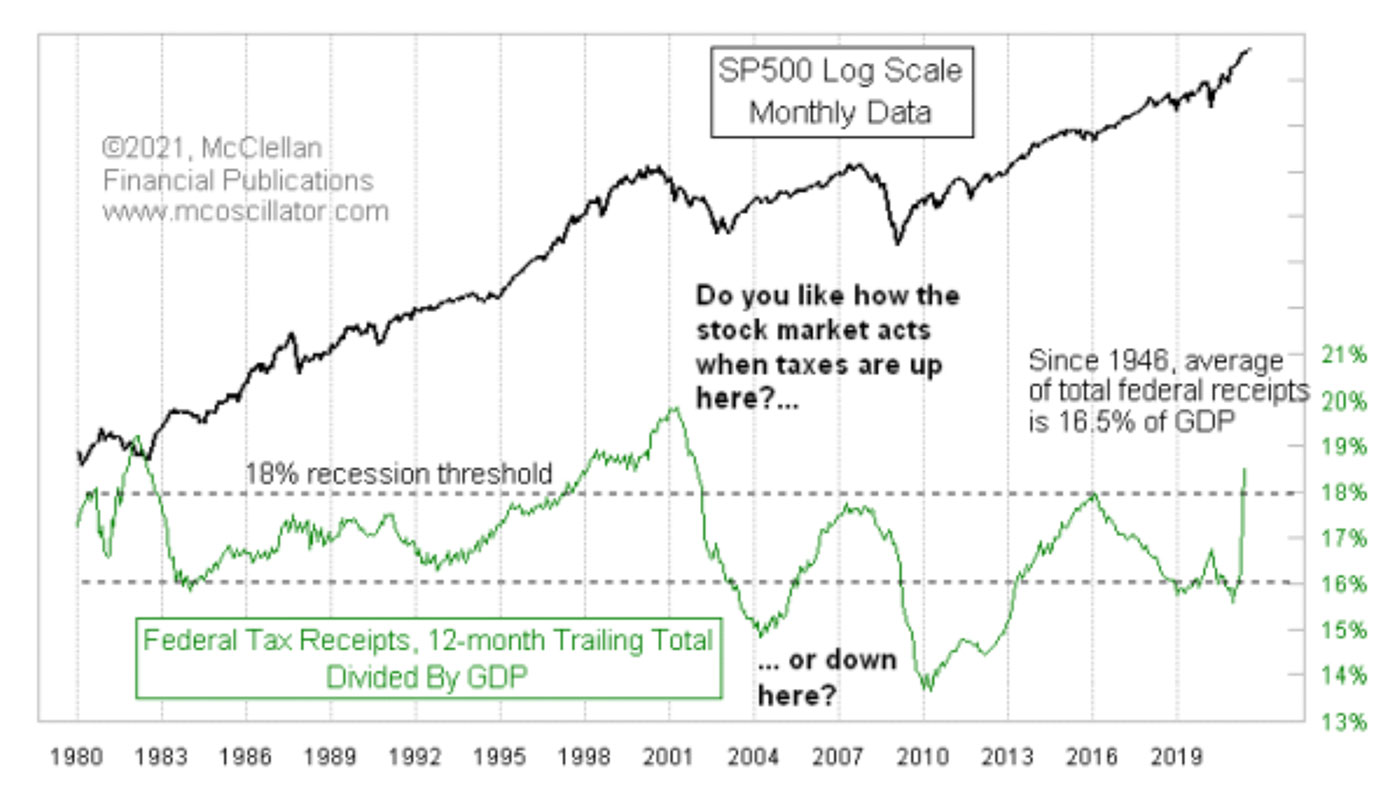

Low taxes are a big stimulus to economic activity. Everyone knows that. Curiously, not everyone understands that high taxes are a giant restriction on the economy. The following chart offers some evidence of that.
Several decades of history show us that tax collections that represent too high a portion of GDP restrict the economy, so much so that it tends to snuff out economic activity. The magic number appears to be 18%, since every time total tax receipts as a percentage of GDP has gone above that number it has resulted in a recession. Even getting close to 18% is sometimes enough.

Source: McClellan Financial Publications
A wise reader will be skeptical of this argument. Some might even note that in the late 1990s the tax collections got up above 18% and it did not seem to matter (for a while anyway). While that is true, additional pieces of evidence tend to refute that assertion.
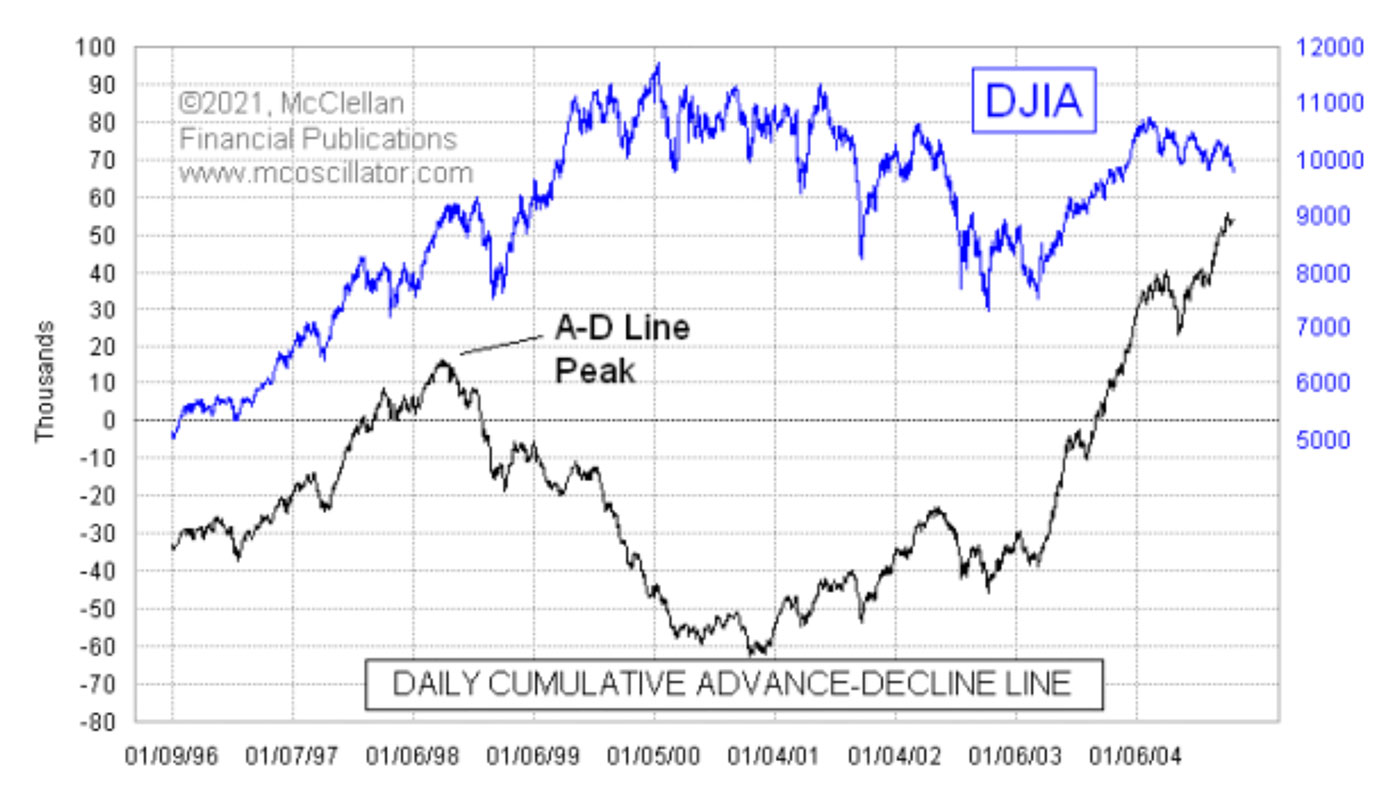
The first is that the NYSE Advance/Decline Line (A-D Line) peaked in early 1998 (Figure 2), well ahead of the final top of the internet bubble in 2000. In other words, the average stock was already suffering starting in early 1998. So the premise that the economy successfully survived tax rates above 20% of GDP is not true.
FIGURE 2: ADVANCE/DECLINE LINE COMPARED TO DOW JONES INDUSTRIAL’S TREND

Source: McClellan Financial Publications
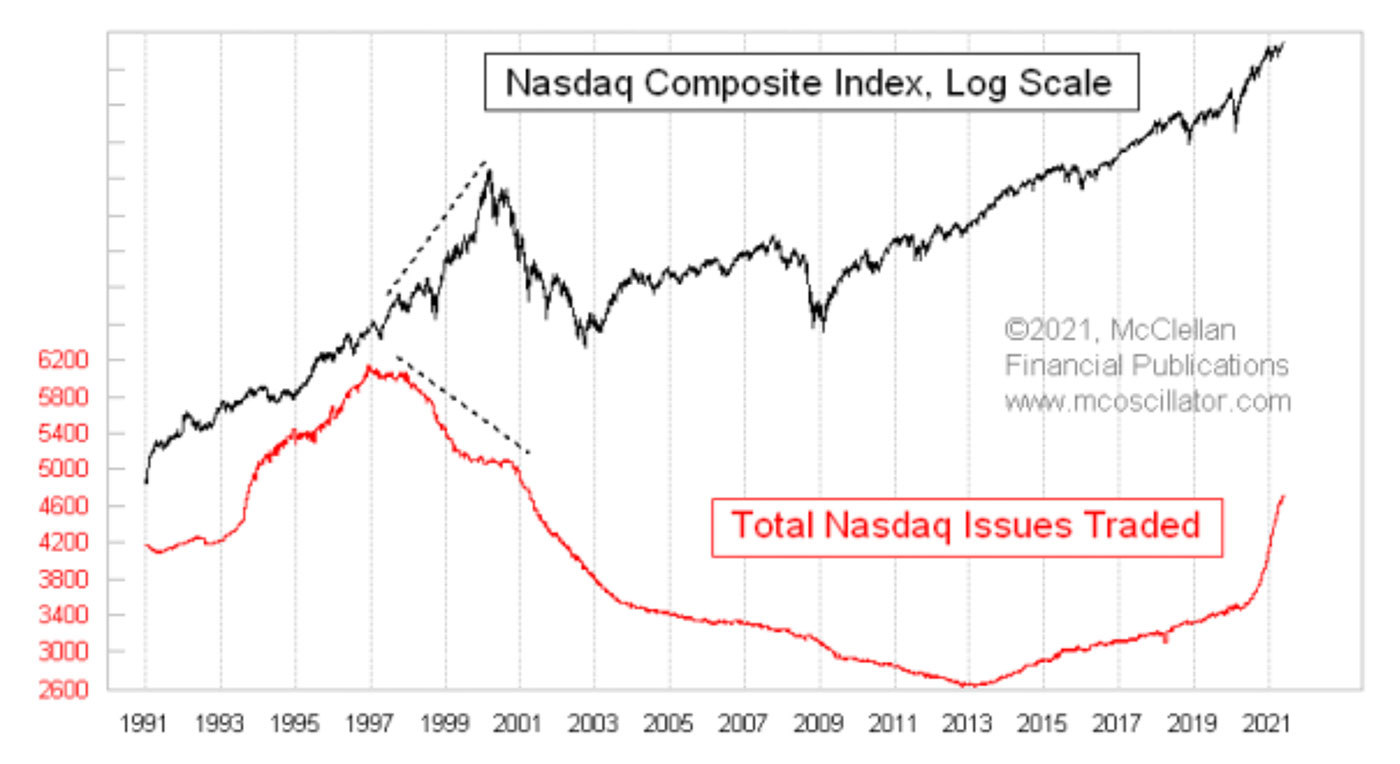
The second point is that destruction was happening even during the latter stages of the 1990s internet bubble. The total number of NASDAQ-listed issues actually peaked in December 1996, years before the final price peak for the NASDAQ Composite Index. By the time the final price top arrived, the number of listed issues was already down by 17%, as companies were getting delisted. The dismantling of the internet bubble was happening well before the final price top, thanks in part to high taxes taking liquidity out of the economy.

Source: McClellan Financial Publications
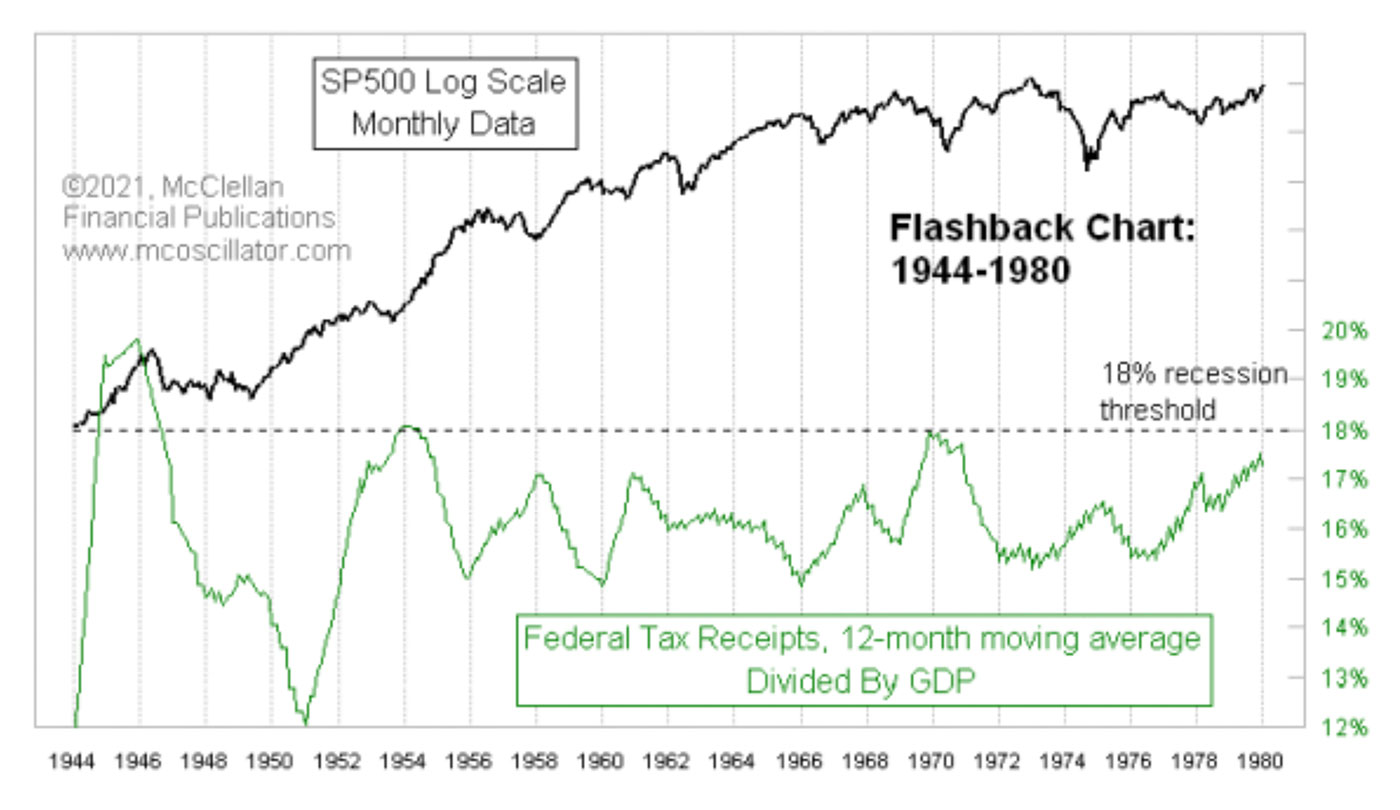
Figure 4 takes the principle of high taxes stifling the economy back to WWII, when high tax rates were needed to pay for the war effort and for the money that Uncle Sam borrowed in the form of “war bonds.”

Source: McClellan Financial Publications
The point in extending the history back this far is that instances of a high federal tax rate, above 18% of GDP or sometimes even close to that level, have a longstanding history of being bad for the economy.
All of this to say that it really is a big deal that the past 12 months have seen total tax receipts as a function of GDP rise up above 18%. Never mind that expenditures are far above that figure; that is a separate argument. Eating too much of the seed corn is a sure way to snuff out the survival of the village. Taking too much of the economic output in the form of taxes is a similarly excessive bite.
We don’t know exactly how this is going to play out in the months ahead, but it is not good news for stock market bulls.
The opinions expressed in this article are those of the author and do not necessarily represent the views of Proactive Advisor Magazine. These opinions are presented for educational purposes only.
This is an edited version of an article that first appeared at McClellan Financial Publications on Aug. 5, 2021.
 Tom McClellan is the editor of The McClellan Market Report newsletter and its companion, Daily Edition. He started that publication in 1995 with his father Sherman McClellan, the co-creator of the McClellan Oscillator, and Tom still has the privilege of working with his father. Tom is a 1982 graduate of West Point, and served 11 years as an Army helicopter pilot before moving to his current career. Tom was named by Timer Digest as the #1 Long-Term Stock Market Timer for both 2011 and 2012. mcoscillator.com
