During a recent presentation I gave about the VIX, I was asked one question that has come up many times over the last year: Why has the VIX been so low during this bear market? Why did it never spike above 40 in 2022 or 2023?
I have seen many theories on this. One popular theory is that the introduction of daily expirations for SPX (S&P 500) options has shifted volatility measures. Since portfolios can be hedged in shorter time frames, this may have dampened longer implied volatility measures like the VIX, which looks 30 days out.
This theory sounds reasonable, and daily options expirations could certainly impact VIX readings. But it is difficult to measure just what the impact might be. Sometimes the simplest explanations are the best. So let’s consider a simple, measurable explanation for why the VIX has yet to exceed 40 during this bear market (if we are really still in it).
First, let’s review what the VIX is. The VIX is an index published by the Chicago Board Options Exchange (Cboe) that measures implied volatility. It does so by examining S&P 500 options prices that have between 23 and 37 days until expiration (average 30 days). The VIX is forward-looking. It does not use any measures of past price action.
Historical volatility (HV) is a separate, backward-looking measure of volatility. It looks at price changes over the recent past to measure how volatile the market has been. This is also referred to as “realized” volatility. The VIX measures “implied” volatility. Neither calculation has anything to do with the other. But as you will see, they are highly correlated. This is thanks to human nature.
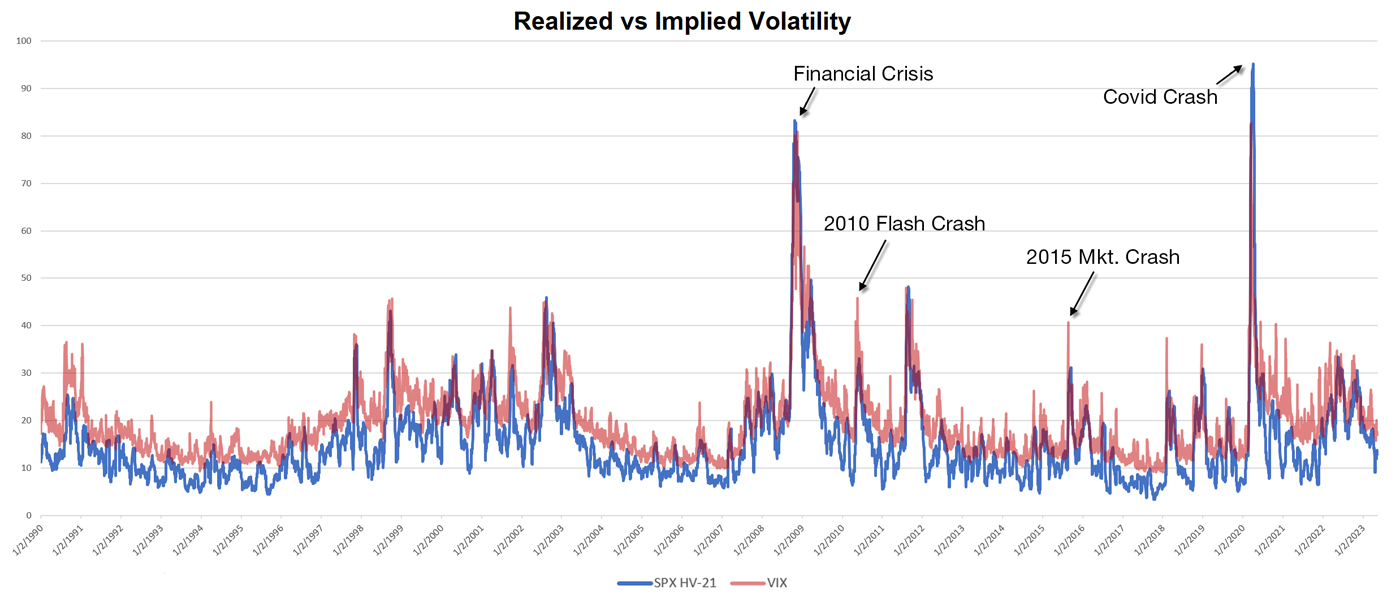
When considering what volatility expectations might be over the next month, the easiest way for a person to estimate this would be to look at what volatility has been over the past month. One month forward is rounded to 30 days for the VIX. One month backward can be rounded to 21 (trading) days for HV. The following chart shows VIX readings in red and the 21-day HV of SPX in blue, going back to the inception of the VIX in 1990.

Sources: Quantifiable Edges, CBOE, TradeStation
A few notes:
- Perhaps the most apparent observation I could make about the chart is that the lines tend to move together. They rise and fall at about the same time, never getting too far off track.
- The red line (VIX) is typically above the blue (HV). So estimations of implied volatility are generally a little higher than what has been seen from a volatility standpoint in the recent past. This makes sense. The action of the next 30 days is unknown, and options sellers will typically be able to demand a premium for taking on unknown risks.
- The VIX peaked at around 36.5 in 2022. HV never exceeded 33.5. The spread between the two for much of the year appears reasonable compared to past markets.
- In 2022, the largest the spread reached between VIX and HV was 19 points on Jan. 26. For context, there have only ever been two times when VIX exceeded HV by more than 21 points. Both of those times were due to quick contractions in HV that the VIX took a bit longer to adjust to. They were in January of 2009 and 2021.
- There are a couple of instances marked on the chart (in 2010 and 2015) where HV reached levels similar to the 2022 highs, but VIX spiked quite a bit higher. What’s important to note about both these instances is that they were quick market shocks. HV transitioned from a low level to up over 30 very quickly both times. In other words, there was a brief but powerful market shock that VIX quickly adjusted to, and this caused it to elevate more substantially above HV.
- The 2022 high levels in HV were achieved through a more gradual rise. Options traders had more time to adjust to increased volatility, so the VIX remained more in line with HV as compared to the 2010 and 2015 instances.
Considering the observations above, it does not appear that VIX action during this bear market has been unusual. People should not expect implied volatility to be extremely high when realized volatility is not extremely high. I don’t believe the options market has changed in such a way that the VIX is never going to get into the 40s or 50s again. When realized volatility next spikes to extreme levels, you can expect the VIX will also.
The opinions expressed in this article are those of the author and the sources cited and do not necessarily represent the views of Proactive Advisor Magazine. This material is presented for educational purposes only.
 Rob Hanna has worked in the investment industry since 2001. He is the founder and publisher of Quantifiable Edges, a quant-based website where he also publishes a newsletter. After managing a private investment fund through Hanna Capital Management LLC from 2001 to 2019, Rob joined Capital Advisors 360, where he now serves as a registered investment advisor and focuses on short-term and quantitative strategies. quantifiableedges.com
