
September has a reputation for being the worst month of the year for the stock market. And that is deserved.
Since 1960, the average September return is -0.59%. The only other month with a negative average return for the same period is June, which has had an average return of -0.01%, just under breakeven. The best month over this time frame has been April, which has averaged a gain of 1.61%.
What most people don’t realize about September is that the struggles can all basically be attributed to just one week. Years ago, I dubbed it the “Weakest Week,” and the weakness has continued to persist. The week I am referring to is the week following the third Friday in September.
Many people will note that the third Friday of the month is when monthly options expire. And there are some consistent seasonal tendencies that occur around this. The week of options expiration is often bullish for the market, but the week following often sees some of those gains given back.
But what is specifically interesting about the week after the third Friday in September is that the bearish bias has been in place since well before options expiration was even an event. (S&P Index options began trading in 1984.)
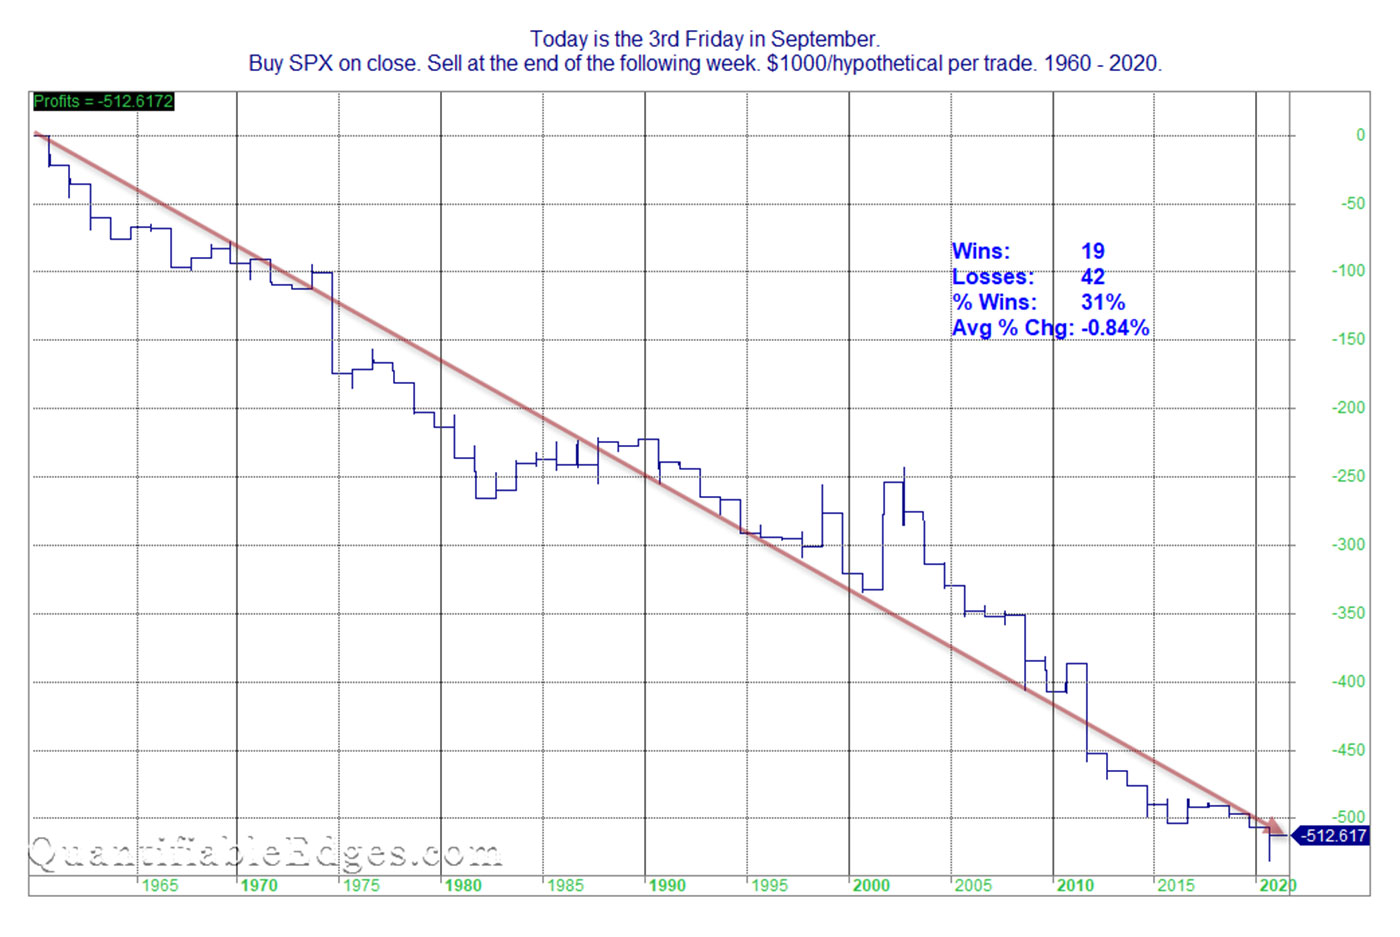
The bearish tendency can be seen Figure 1, which looks back to 1960.
FIGURE 1: TRADING RESULTS FOR THE WEEK AFTER THE THIRD FRIDAY IN SEPTEMBER (1960–2020)

Source: Quantifiable Edges. Data provided by Norgate Data. Chart produced in AmiBroker.
You’ll note the average return this particular week since 1960 has been -0.84%. I already mentioned the average September return over the same period was -0.59%. So all of the net losses and more are attributable to this one particular week.
The downward persistency of the curve shows that the bearish tendency has been quite consistent over the last 61 years. There was a stretch in the late 1980s when there was a series of mild up years. Since 1990, it has been pretty much all downhill.
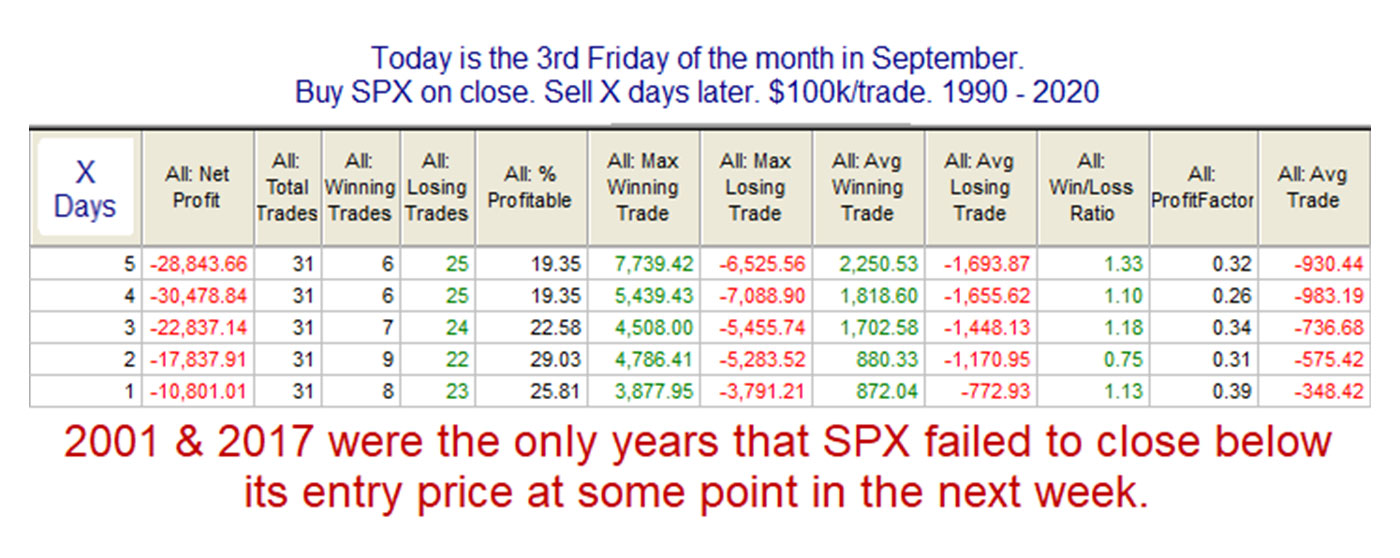
Table 1 shows different scenarios and the results for buying at the close of the third Friday in September and then selling “X” (1, 2, 3, 4, or 5) days later from 1990–2020.
TABLE 1: DIFFERENT TRADING SCENARIOS FOR THE WEEK AFTER THE THIRD FRIDAY IN SEPTEMBER (1990–2020)

Source: Quantifiable Edges. Data from TradeStation.
The bearish tendency presented in Table 1 appears quite strong. The SPX has been lower over 80% of the time four and five days after the third Friday of September. I note below the table that the only instances not to post a lower close at some point during the following week were in 2001 and 2017. The 9/11 attacks certainly made for unusual circumstances in 2001. While 2017 did not see a decline, the SPX only rose two points, so it was not much of a victory for the bulls.
Overall, September has been the weakest month, but the weakest week in September has been the real market villain.
 Rob Hanna has worked in the investment industry since 2001. He is the founder and publisher of Quantifiable Edges, a quant-based website where he also publishes a newsletter. After managing a private investment fund through Hanna Capital Management LLC from 2001 to 2019, Rob joined Capital Advisors 360, where he now serves as a registered investment advisor and focuses on short-term and quantitative strategies. quantifiableedges.com
