
Seasonality strategies: Sell in May and go away?
Seasonality strategies: Sell in May and go away?

The old Wall Street adage “Sell in May and go away” has some strong support in the data, but probably not in the way most investors think. An excerpt from the book “Why Bad Things Happen to Good Investments,” by William T. Hepburn, explains why and shows that November is usually the start of an important market period.
The old stock market adage “Sell in May and go away” refers to the idea that there is not much money to be made in stocks after May 1, so one might as well do nothing. It does work in many years but probably not just because it rhymes. The seasonal market peak actually occurs as late as August 1, but it is hard to find a word that rhymes with “August.”
Many people believed that this seasonality is caused by the lower volume of activity on Wall Street as many rich traders go on summer vacations. But as with most things on Wall Street, it is due to money flows. Trading volume does not drop much in summer, but observable money flows do drop off in summer. So, let’s follow the money, as the old saying goes, to see what drives this seasonal tendency.
In the fall, factories begin gearing up for Christmas. More workers get hired, more truck drivers are needed to deliver things, and more clerks are needed to sell the goods. All this economic activity gets money moving in the economy and some of that money starts finding its way into the financial markets through 401(k) plans and other savings.
Around the end of the year come mutual fund distributions. Profit-sharing payments and tax refunds occur during the first months of the new year, events that put money into consumers’ hands, some of which also finds its way into the financial markets.
In the spring, the money flows into the stock markets ebb and begin to flow the other way. Folks who did not get tax refunds earlier now get to write big checks to the government.
The largest influence on this money flow, however, is home sales. Were you aware that more people buy homes in the summer than winter? They do. So, where do you think that house money was before it is put down on a house? It comes from stocks, bonds, mutual funds, and savings. This money flows out of the financial markets into real estate during summer.
The simple explanation for this warm weather/cold weather bias in the markets is that during warmer months there is just less money that people can devote to the stock market.
How persistent is this phenomenon? Table 1 shows results looking back to 1984. I took the S&P 500 closing prices and lumped them into warmer, May 1–Oct. 31, blocks and colder, Nov. 1–April 30, blocks. The stronger of the six-month periods for the year is highlighted.
Since 1984, for the S&P 500, 20 out of 33 cooler six-month periods have outperformed the six warmer months that preceded them. That is a 60% accuracy rating. Ignoring the years in which distortion was caused by the real estate bubble leading to the 2007–08 financial crisis, this ratio becomes 20 out of 28 years that colder periods outperformed warmer ones, or a 71% accuracy for this indicator. Examining the 30 stocks of the Dow Jones Industrial Average’s seasonality over this same period, colder periods have outperformed warmer periods 70% of the time.
Considering that the stock market goes up slightly more than half of the time, a simple strategy that can produce 60% or 70% wins can improve investment performance significantly.
More importantly, when the colder months outperform, they do so by a much wider margin than warmer months. Simply adding the six-month returns from 1984, the warmer months produced a gain of 63.34% and the colder months produced a gain of 253.42%, four times the gain in warmer months.
TABLE 1: SEASONALITY RETURNS FOR WARMER VERSUS COLDER MONTHS OF THE YEAR
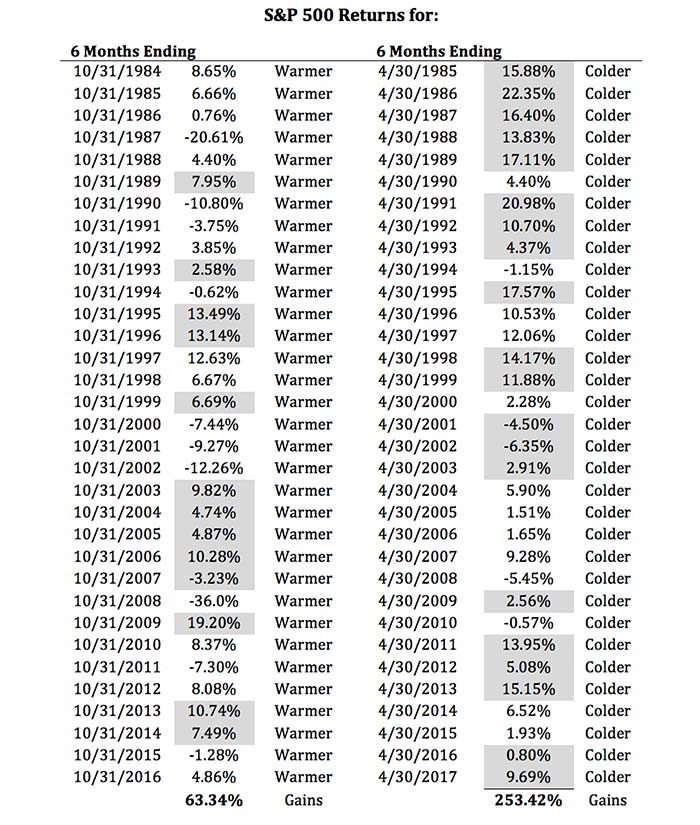
Editor’s note: Gray highlights show the better-performing period of each 12-month period.
One of the many reasons for this big imbalance in returns is that money flows had been tapering off for many months prior to the historic stock market crashes, which occurred at the end of the warmer six-month periods. If we look back to the biggest stock market declines in history—1929, 1987, 2001, or 2008—each of these happened in September or October. It should be no surprise that economic shocks are felt much harder in markets that are already weakened by poor money flows.
This tells us that the warmer months not only produce fewer winning periods but also include most of the really ugly stock markets. If you think about this, why would anyone want to stay fully invested all summer long? It just does not make sense, unless one has never seen the actual data. Funny how Wall Street never mentions this except to repeat their little ditty each May 1.
Let’s apply the math of gains and losses to a $100,000 investment in the Dow from November 1953 through the end of April 2017. Table 2 shows how returns would look to a buy-and-hold investor, compared to the results someone would achieve by investing only in the colder months or only in the warmer months, with their portfolios in cash the remainder of the year.
TABLE 2: $100,000 INVESTED IN FULL YEAR VERSUS COLDER/WARMER MONTHS
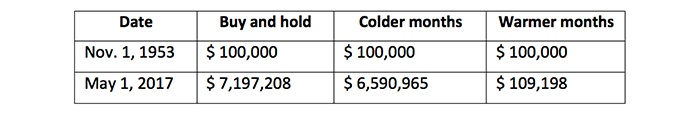
Editor’s note: Why does buy-and-hold investing outperform the cumulative total of the colder and warmer months in Table 2? This is a direct result of compounding. The colder and warmer months individually represent half the months in which the buy-and-hold investor is invested. During up periods in the warmer months, the balance upon which returns are calculated is considerably lower, dramatically reducing gains. Interestingly, being invested in just 375 colder months comes within 9% of buy-and-hold investing over 750 months while avoiding the months that historically tend to have the most significant market volatility events. In the years studied in Table 1, which cover 33 12-month periods, colder months had five losing periods with the steepest loss being 6.4%; warmer months had 11 losing periods with the steepest loss being 36%.
Some segments of the markets are not affected by this seasonality, nor are some regions, so blindly following the May 1 to November 1 time frames presented in this simple example is probably not a good idea. The late analyst Sy Harding did several studies showing that the earliest the seasonal influence gets traction in the spring is April 21, and the earliest it ended was October 16. Harding used technical indicators that told him when the change actually occurred. Tom McClellan, the editor of the “McClellan Market Report,” has done studies that show that the average seasonal peak price in warmer months occurs on August 1 and then the market tends to taper off.
This year, the stock market remained strong through August, but often the longer a market waits to fulfill a seasonal expectation, the quicker it reacts when it does turn down. Just because the market has been rallying, this is still a high-risk market environment.
There is a simple way to take advantage of this clear seasonal tendency, and that is to either have a proactive strategy in place to detect when money flows are changing and move money out of harm’s way in warmer months—or hire someone who does. I have found that one simple tactic is to be aware of these seasonal tendencies and be ready to sell weaker investments as they lose strength during the summer and wait to reinvest that money until after the weather cools down.
As we learn from the old story about the man who drowned crossing a lake that averaged only three-feet deep, averages can be deceiving. Taking action on the dates mentioned above won’t always work. But it is still important to have a plan that tells you when it may be time to make moves with your investments and to monitor market trends closely. That is what proactive management is all about.
 The opinions expressed in this article are those of the author and do not necessarily represent the views of Proactive Advisor Magazine. These opinions are presented for educational purposes only.
This article is an edited excerpt from “Why Bad Things Happen to Good Investments,” by William T. Hepburn. Mr. Hepburn’s book may be purchased at Amazon.
 Will Hepburn is founder and president of Hepburn Capital Management, LLC, which focuses on developing, implementing, and teaching innovative investment strategies. Mr. Hepburn is a past president of the National Association of Active Investment Managers and managed two mutual funds prior to entering private practice. He has taught classes on finance and investing at the college level since 1990 and is the author of “Why Bad Things Happen to Good Investments.” https://hepburncapital.com/
Recent Posts: