


U.S. markets have been the world leaders for so long that it is easy to forget that there are other markets that should be considered. The U.S., Developed Countries, and Emerging Markets all peaked in 2007 at record highs. All then suffered through terrific bear markets: U.S stocks fell 56%, followed by a 57% drop for Developed Countries and a precipitous dive of 67% for Emerging Markets.
But that was nine years ago, and the recovery has been led by the U.S. Since the peak, the S&P 500 (the proxy for the U.S. markets) has recorded over 165 new all-time highs, versus just 35 for Developed Countries and only one for Emerging Markets.
The U.S. markets are also getting all of the “face time” in the financial media with the new highs, and this has been going on since March 2013. Developed Countries received little or no news when they broke out to new highs in May of this year. And we did not see any headlines after Emerging Markets finally surpassed its old high set 10 years ago on Sept. 19.
FIGURE 1: BULL MARKETS—GLOBAL LEADERS AND LAGGARDS
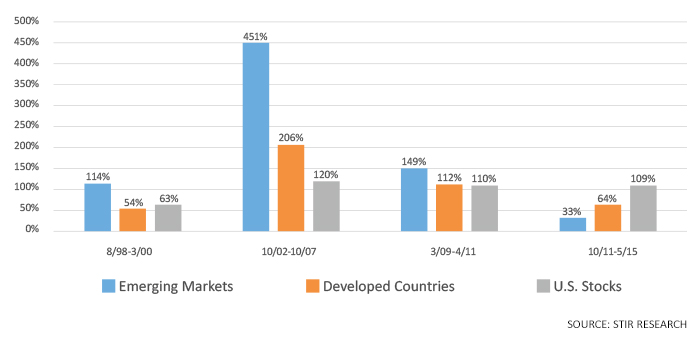
Now that we are in a global secular bull market, the big question becomes who will end up being the leader in the current bull market cycle? Surprisingly, there is a big spread between gains for the U.S. and Emerging Markets in almost all of the recent bull markets: 80% in the bull market of 1998–2000, 275% in the 2002–2007 bull run, and 220% in the 2011–2015 advance.
As the chart in Figure 1 indicates, leadership has always swung between Emerging Markets and the U.S., and Developed Countries appear to always be the middle child. So, picking between the two, Emerging Markets or the U.S., who will end up being the leader in this bull run?
Coming off the lows of February 2016 through the end of 2016, it was a dead heat between Emerging Markets (up 24%) and the S&P 500 (up 25%). But in 2017, Emerging Markets has taken the clear lead, up almost twice as much as the U.S., 28% versus 14%.
The Emerging Markets of today are not the same as they were one or two decades ago. The old image was to equate Emerging Markets with Basic Materials and Energy. But not today. Think of the Internet, Semiconductors, Technology, and Financials. That is the new leadership, with Technology and Financials making up 49% of the overall index weight of Emerging Markets, with only 14% in Energy and Basic Materials. It looks a lot like the U.S. markets, with its 37% allocation to Technology and Financials, and 9% to Energy and Basic Materials. Emerging Markets is home to some of the world’s largest and fastest growing companies: Alibaba, Taiwan Semiconductor, Samsung, and Tencent are examples.
Will Emerging Markets gain 20%-plus in the next year?
One indicator that has worked well for predicting future moves for the S&P might just apply to Emerging Markets. History has shown that the one-year performance for the market after hitting a new high—following a lapse of at least 300 days since the prior high—has produced an average gain of 21% in secular bull markets. It makes sense, if the market has gone more than 300 days since making its last high, that all of the excess optimism found at the prior high has been washed away. And therefore, once it does break above its old high, it has new energy to run to new highs.
Emerging Markets went 3,611 days before hitting a new high and therefore clearly qualifies. So, mark your calendars for Sept. 19, 2018, and see if Emerging Markets will hit its target of a 21% gain.
The opinions expressed in this article are those of the author and do not necessarily represent the views of Proactive Advisor Magazine. These opinions are presented for educational purposes only.
 Marshall Schield is the chief strategist for STIR Research LLC, a publisher of active allocation indexes and asset class/sector research for financial advisors and institutional investors. Mr. Schield has been an active strategist for four decades and his accomplishments have achieved national recognition from a variety of sources, including Barron's and Lipper Analytical Services. stirresearch.com