


Twenty-six years ago, a new type of trading instrument was offered for the first time in the U.S. for equity investors. The SPY (SPDR S&P 500 Trust) was the very first ETF developed for the U.S. stock market, launched by Boston-based asset manager State Street Global Advisors.
In the past five years, there has been exponential growth in the ETF market. The number of ETF offerings, according to ETF.com, skyrocketed from approximately 1,450 in 2014 to over 5,000 worldwide in 2019. (These numbers are estimates. ETF issues are frequently dissolved and new ones are added regularly.)
Research firm Statista notes that global assets in ETFs have surpassed $4.6 trillion.
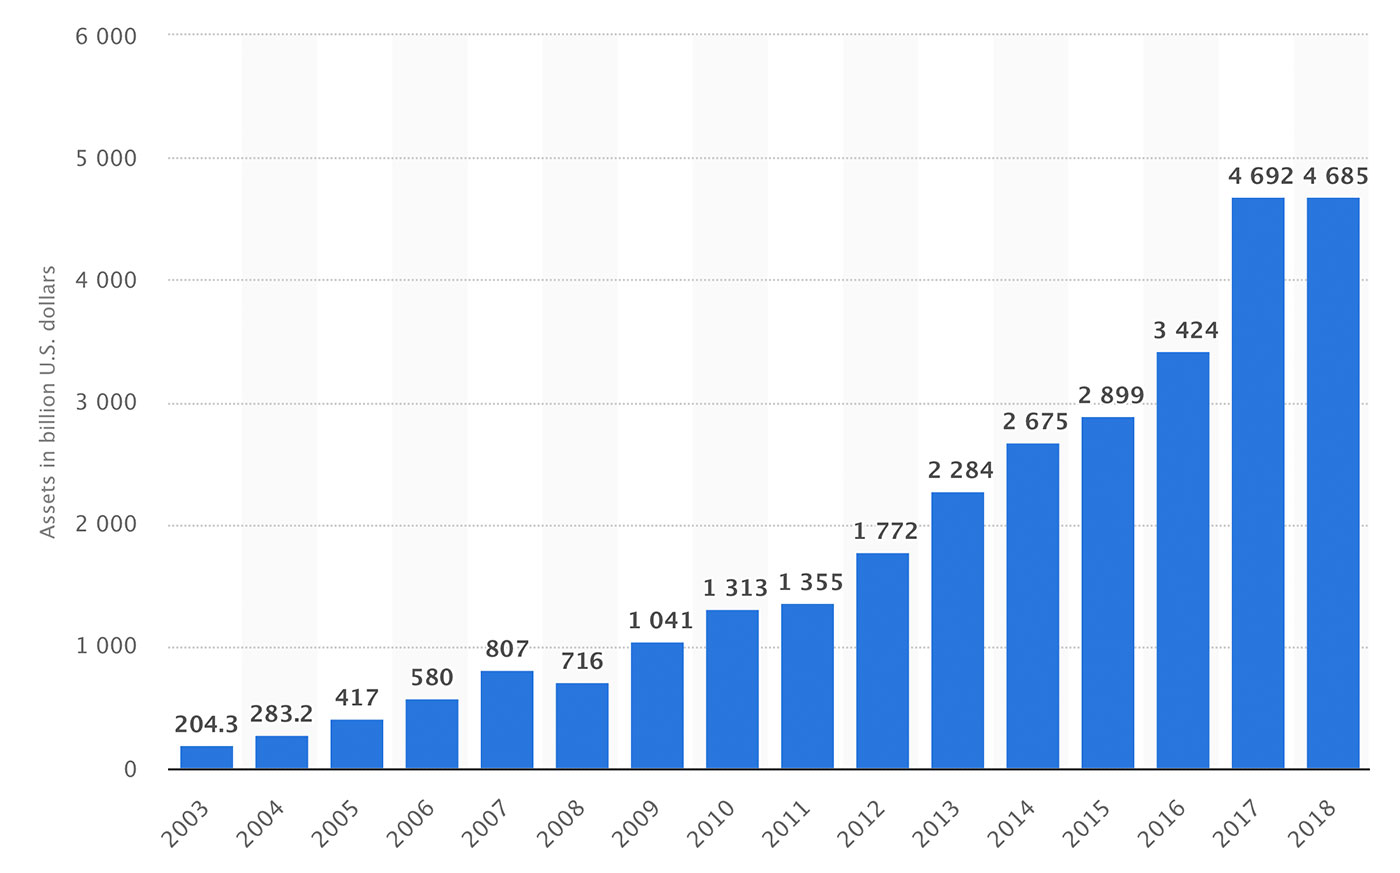
Source: Statista
While the compound annual growth rate (CAGR) for ETF assets has been impressive, the overall size of the ETF market is still dwarfed by other investment market classes. SIFMA (Securities Industry and Financial Markets Association) wrote in late 2018,
“The U.S. domiciled ETF market is still small compared to other U.S. markets—fixed income markets are 11.6x greater than ETFs; equities are 9.4x ETFs; and MFs are 5.5x ETFs. A truer parallel can be drawn between investment products, ETFs and MFs, as well as to the growth experienced in the development of the MF industry. Since 2000, ETFs grew at a 25% CAGR, versus 6% for MFs.”
Although 2018 was somewhat challenging, 2019 should see continued growth for ETFs.
Investors need to be able to evaluate an ETF as a long-term investment—not only by its fundamental data, characteristics, and underlying components, but also on a technical basis to determine if that ETF is viable for a long-term investment portfolio.
Not all ETFs are designed for long-term investing. Many of the newer ETFs were developed strictly for buy-side institutions for mitigating downside trend risk or as hedging instruments during a bear market.
The number of ETFs listed on U.S. exchanges at this time is approximately 2,266. This is far too many for investors to evaluate with traditional fundamental data.
Classifications for U.S. ETFs include the following categories:
- 1,593 equity ETFs based on stock indexes, industries, dividend, and cap size.
- 404 fixed-income ETFs, which include Treasury bonds and corporate bonds.
- 63 commodity ETFs based on commonly traded commodities.
- 63 asset-allocation ETFs, which are a combination of stocks, bonds, and other assets.
- 56 alternative ETFs, which are generally not suitable for long-term investing.
- 34 currency ETFs, which are based on major world currencies and are not usually held long term.
Although ETFs based on the S&P 500 are the most popular, investors should consider the ease with which an ETF can assist in diversification. As an example, focusing on a sector that is poised for strong growth can provide additional opportunities for investing and diversification.
An investor could streamline a huge list of ETFs down to just 10 that I prefer to evaluate periodically from a technical perspective. These are XLK (technology), VNQ (real estate), XLF (financial), BGT (floating rate income), XLV (health care), XLY (consumer discretionary), XLE (energy), XPL (consumer staples), XLI (industrials), and XLU (utilities).
The next step is to study the charts for each of these ETFs to select the best from this group for a long-term hold. Figure 2 presents a weekly view of XLK, the Technology Select Sector SPDR ETF.
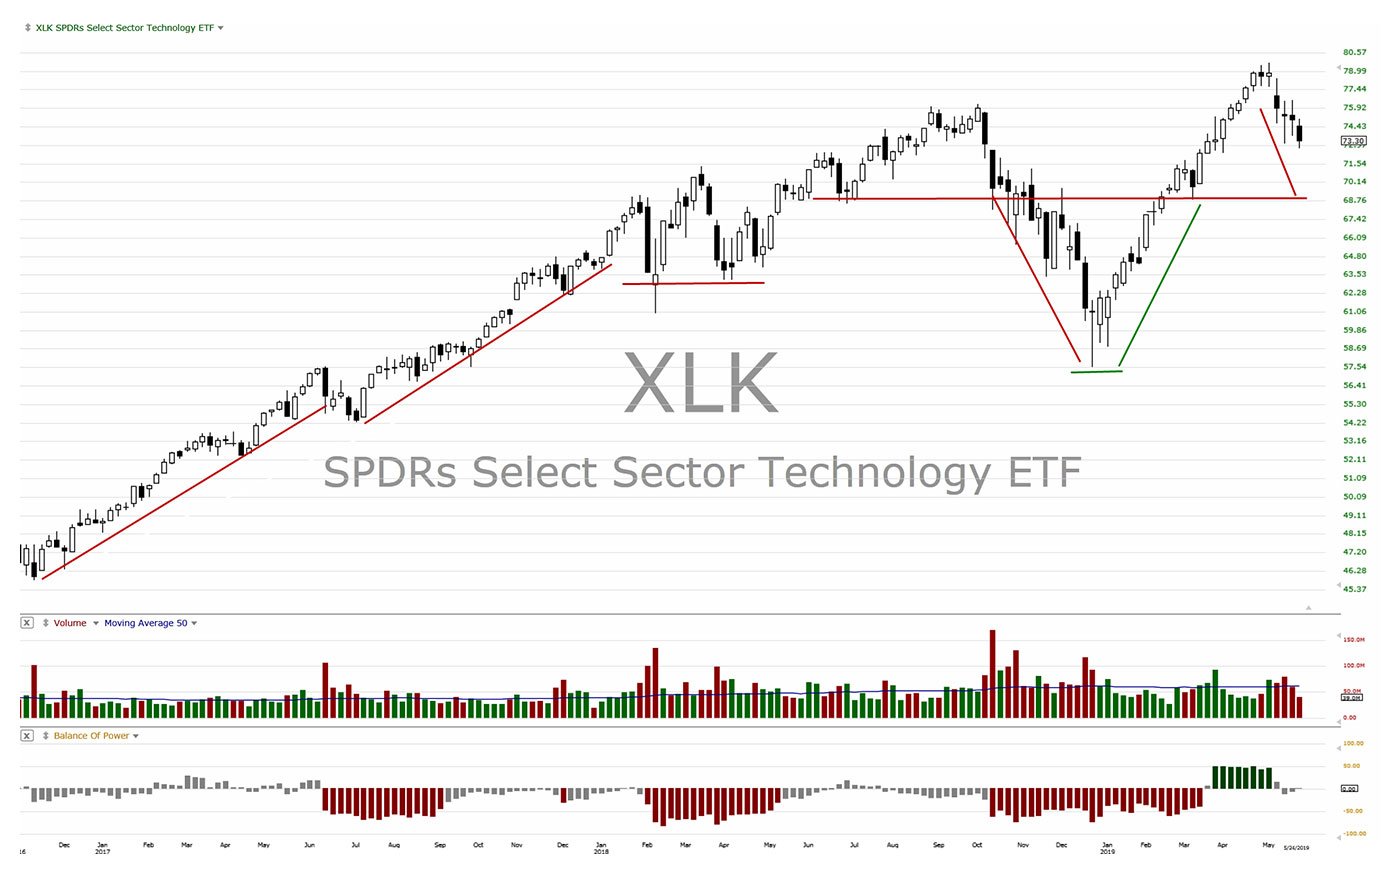
Source: TechniTrader technical analysis using a TC2000 chart, courtesy of Worden Bros. Chart data as of the week of 6.3.19.
XLK has had a relatively strong growth year so far in 2019, despite a well-publicized pullback in May. The technology sector, as represented by this ETF, has been the best performer compared to other sector ETFs. Technical analysis shows that this sector was recently in a minor correction mode (though a strong rally for U.S. equity markets last week took XLK over 5% higher). This would be a sector to monitor if it continues its correction and begins a technical bottom where it can find support. The entry would then be at a better price than buying it at the speculative high that formed in late April.
Since the price of the ETF will closely follow the stock prices or value of the assets in that ETF, volume becomes an important data point to follow closely. Volume increasing for an ETF over time indicates more demand and more interest in that ETF as an investment. Volume for XLK shows it is a widely held ETF with plenty of interest for a longer-term hold.
“Balance of Power” (BOP), seen as the lower indicator in Figure 2, shows whether large institutions, often via dark pools, are buying or selling the ETF at this time. This is different from “Volume,” the upper indicator in Figure 2, which is the total number of all transactions for that day, week, or another time frame. For XLK, the BOP indicator shows intermittent large-lot selling in 2018–2019. This corresponds with the fundamental data, which showed that authorized market participants lowered their inventories of stock for many SPDRs during that time.
ETFs offer long-term investors many ways of diversifying their portfolio beyond mutual funds, and they have numerous advantages. Using an ETF’s chart to analyze the trend and the cycle helps provide a visual graphical representation. This shows the strength of the underlying assets in that ETF and the potential for growth over time. Incorporating charts into your ETF selection process should increase the return on investment for your portfolio.
 Martha Stokes, CMT, is the co-founder and CEO of TechniTrader and a former buy-side technical analyst. Since 1998, she has developed over 40 TechniTrader stock and option courses. She specializes in relational analysis for stocks and options, as well as market condition analysis. An industry speaker and writer, Ms. Stokes is a member of the CMT Association and earned the Chartered Market Technician designation with her thesis, "Cycle Evolution Theory." www.technitrader.com